| Red | Green | Blue | |
| z | 17.64 | ||
| znorm | Inf | ||
| sky | -Inf | -NaN | -Inf |
| S/N | 28.8 | 48.6 | 51.3 |
| S/N(c) | 0.0 | 0.0 | 0.0 |
| SN(E/C) |
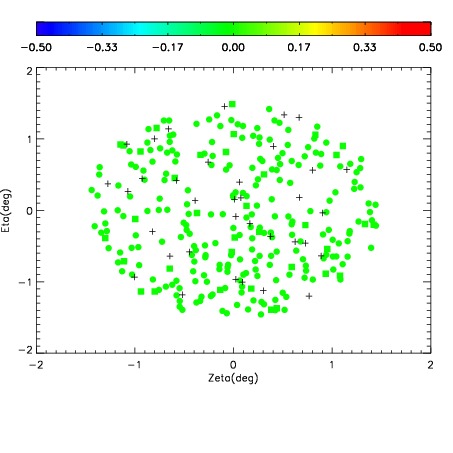
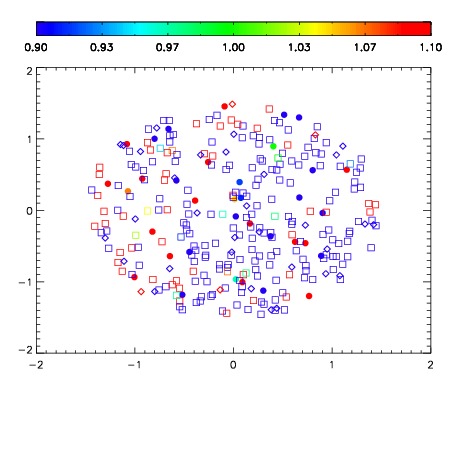
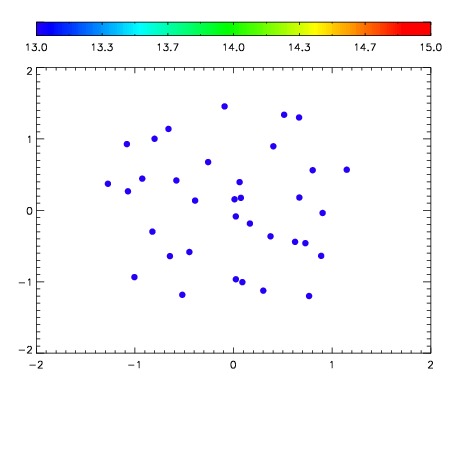

| Frame | Nreads | Zeropoints | Mag plots | Spatial mag deviation | Spatial sky 16325A emission deviations (filled: sky, open: star) | Spatial sky continuum emission | Spatial sky telluric CO2 absorption deviations (filled: H < 10) | |||||||||||||||||||||||
| 0 | 0 |
|
|
|
|
|
|
| IPAIR | NAME | SHIFT | NEWSHIFT | S/N | NAME | SHIFT | NEWSHIFT | S/N |
| 0 | 06470025 | 0.466742 | 0.00000 | 19.1284 | 06470023 | -1.29904e-05 | 0.466755 | 19.1187 |
| 1 | 06470021 | 0.466661 | 8.10027e-05 | 19.1304 | 06470022 | 0.000881192 | 0.465861 | 19.1204 |
| 2 | 06470020 | 0.465952 | 0.000790000 | 19.1250 | 06470019 | 0.00000 | 0.466742 | 19.0880 |
| 3 | 06470024 | 0.465867 | 0.000874996 | 19.1070 | 06470026 | -0.00567925 | 0.472421 | 19.0754 |