| Red | Green | Blue | |
| z | 17.64 | ||
| znorm | Inf | ||
| sky | -Inf | -NaN | -Inf |
| S/N | 29.7 | 50.0 | 53.4 |
| S/N(c) | 0.0 | 0.0 | 0.0 |
| SN(E/C) |


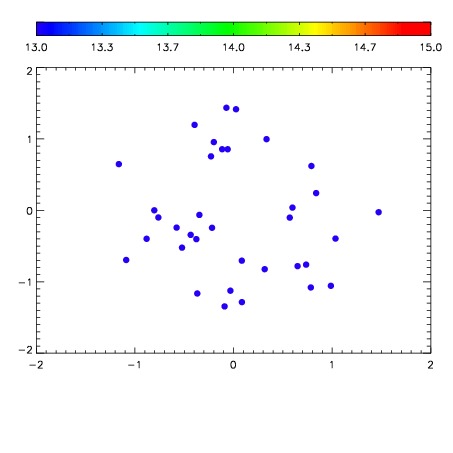

| Frame | Nreads | Zeropoints | Mag plots | Spatial mag deviation | Spatial sky 16325A emission deviations (filled: sky, open: star) | Spatial sky continuum emission | Spatial sky telluric CO2 absorption deviations (filled: H < 10) | |||||||||||||||||||||||
| 0 | 0 |
|
|
|
|
|
|
| IPAIR | NAME | SHIFT | NEWSHIFT | S/N | NAME | SHIFT | NEWSHIFT | S/N |
| 0 | 06440050 | 0.467651 | 0.00000 | 19.1608 | 06440052 | -0.00310979 | 0.470761 | 19.1486 |
| 1 | 06440053 | 0.465433 | 0.00221801 | 19.1634 | 06440048 | 0.00000 | 0.467651 | 19.1630 |
| 2 | 06440049 | 0.466807 | 0.000844002 | 19.1590 | 06440051 | -0.00135170 | 0.469003 | 19.1398 |
| 3 | 06440054 | 0.466319 | 0.00133201 | 19.1360 | 06440055 | -0.00230882 | 0.469960 | 19.1329 |