| Red | Green | Blue | |
| z | 17.64 | ||
| znorm | Inf | ||
| sky | -Inf | -NaN | -Inf |
| S/N | 26.9 | 46.2 | 48.4 |
| S/N(c) | 0.0 | 0.0 | 0.0 |
| SN(E/C) |
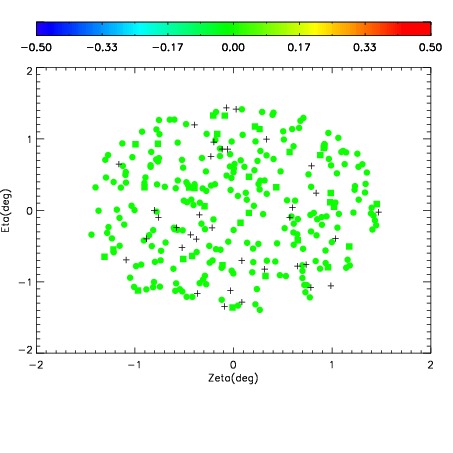
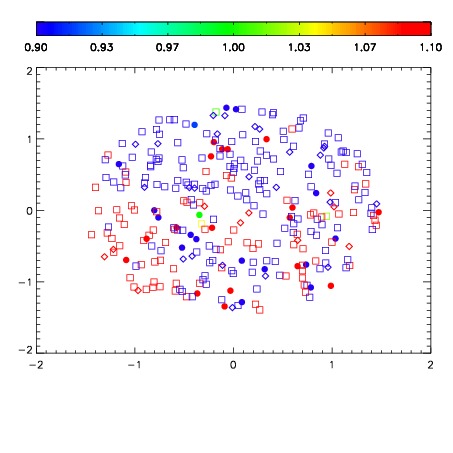
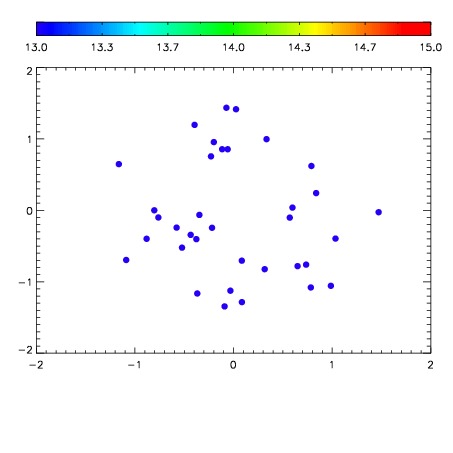

| Frame | Nreads | Zeropoints | Mag plots | Spatial mag deviation | Spatial sky 16325A emission deviations (filled: sky, open: star) | Spatial sky continuum emission | Spatial sky telluric CO2 absorption deviations (filled: H < 10) | |||||||||||||||||||||||
| 0 | 0 |
|
|
|
|
|
|
| IPAIR | NAME | SHIFT | NEWSHIFT | S/N | NAME | SHIFT | NEWSHIFT | S/N |
| 0 | 06670076 | 0.474474 | 0.00000 | 19.0384 | 06670070 | 0.00000 | 0.474474 | 19.0633 |
| 1 | 06670072 | 0.472600 | 0.00187400 | 19.0896 | 06670073 | -0.000406122 | 0.474880 | 19.0865 |
| 2 | 06670075 | 0.473654 | 0.000820011 | 19.0688 | 06670074 | -0.000871592 | 0.475346 | 19.0659 |
| 3 | 06670071 | 0.472171 | 0.00230300 | 19.0033 | 06670077 | -0.00129326 | 0.475767 | 18.8600 |