| Red | Green | Blue | |
| z | 17.64 | ||
| znorm | Inf | ||
| sky | -Inf | -NaN | -Inf |
| S/N | 28.6 | 48.2 | 52.7 |
| S/N(c) | 0.0 | 0.0 | 0.0 |
| SN(E/C) |
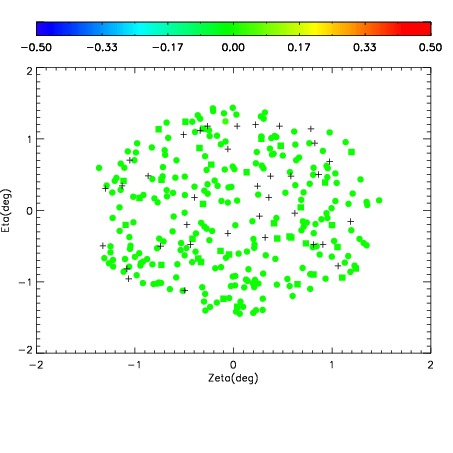
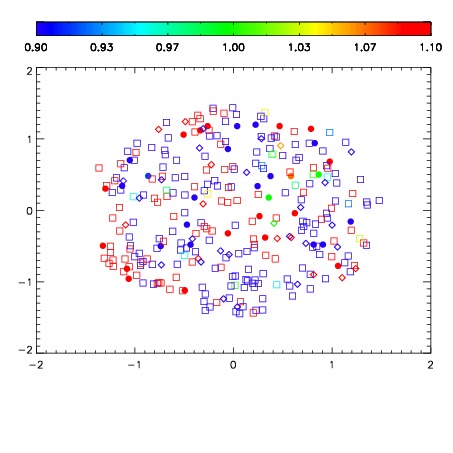


| Frame | Nreads | Zeropoints | Mag plots | Spatial mag deviation | Spatial sky 16325A emission deviations (filled: sky, open: star) | Spatial sky continuum emission | Spatial sky telluric CO2 absorption deviations (filled: H < 10) | |||||||||||||||||||||||
| 0 | 0 |
|
|
|
|
|
|
| IPAIR | NAME | SHIFT | NEWSHIFT | S/N | NAME | SHIFT | NEWSHIFT | S/N |
| 0 | 06970063 | 0.487070 | 0.00000 | 19.1077 | 06970065 | -0.00109884 | 0.488169 | 19.1253 |
| 1 | 06970067 | 0.486003 | 0.00106698 | 19.1843 | 06970068 | -0.00151752 | 0.488588 | 19.1638 |
| 2 | 06970066 | 0.484375 | 0.00269499 | 19.1607 | 06970064 | -5.69390e-05 | 0.487127 | 19.1494 |
| 3 | 06970062 | 0.486494 | 0.000575989 | 19.0856 | 06970061 | 0.00000 | 0.487070 | 19.0836 |