| Red | Green | Blue | |
| z | 17.64 | ||
| znorm | Inf | ||
| sky | -NaN | -Inf | -NaN |
| S/N | 19.7 | 35.5 | 37.3 |
| S/N(c) | 0.0 | 0.0 | 0.0 |
| SN(E/C) |
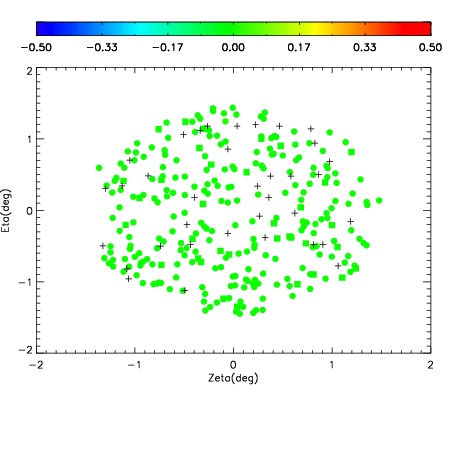
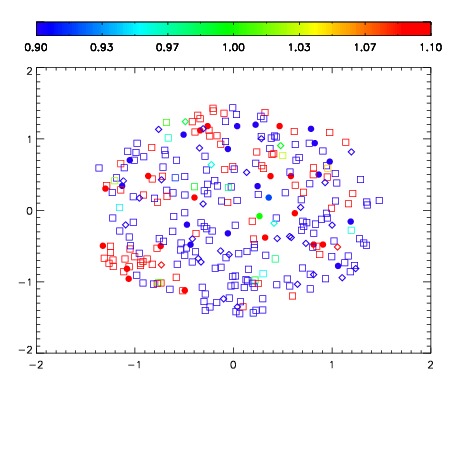


| Frame | Nreads | Zeropoints | Mag plots | Spatial mag deviation | Spatial sky 16325A emission deviations (filled: sky, open: star) | Spatial sky continuum emission | Spatial sky telluric CO2 absorption deviations (filled: H < 10) | |||||||||||||||||||||||
| 0 | 0 |
|
|
|
|
|
|
| IPAIR | NAME | SHIFT | NEWSHIFT | S/N | NAME | SHIFT | NEWSHIFT | S/N |
| 0 | 07040028 | 0.469294 | 0.00000 | 18.7929 | 07040026 | 0.00000 | 0.469294 | 18.8229 |
| 1 | 07040027 | 0.468036 | 0.00125802 | 18.7723 | 07040029 | -0.00155815 | 0.470852 | 18.6516 |
| 2 | 07040031 | 0.466534 | 0.00276002 | 18.3697 | 07040030 | 0.00100420 | 0.468290 | 18.5046 |
| 3 | 07040032 | 0.467359 | 0.00193501 | 18.2919 | 07040033 | -0.000148989 | 0.469443 | 18.4199 |