| Red | Green | Blue | |
| z | 17.64 | ||
| znorm | Inf | ||
| sky | -NaN | -NaN | -Inf |
| S/N | 26.9 | 45.9 | 49.4 |
| S/N(c) | 0.0 | 0.0 | 0.0 |
| SN(E/C) |
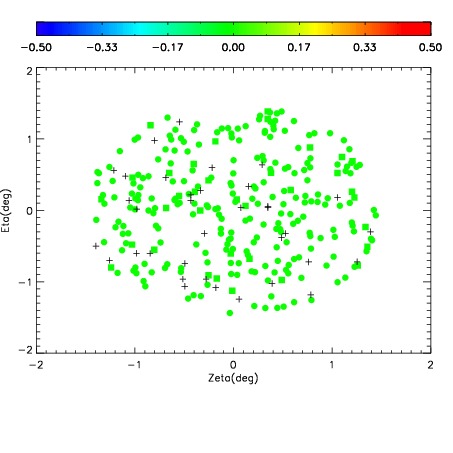
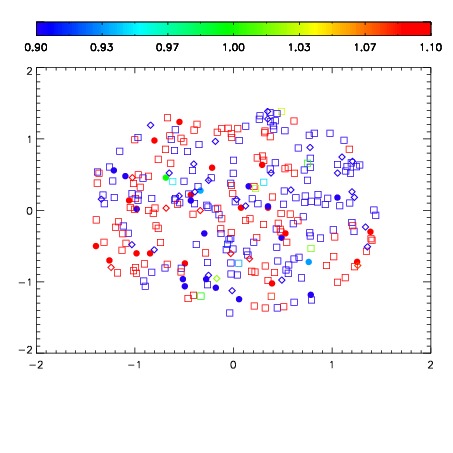


| Frame | Nreads | Zeropoints | Mag plots | Spatial mag deviation | Spatial sky 16325A emission deviations (filled: sky, open: star) | Spatial sky continuum emission | Spatial sky telluric CO2 absorption deviations (filled: H < 10) | |||||||||||||||||||||||
| 0 | 0 |
|
|
|
|
|
|
| IPAIR | NAME | SHIFT | NEWSHIFT | S/N | NAME | SHIFT | NEWSHIFT | S/N |
| 0 | 06950073 | 0.497039 | 0.00000 | 19.1543 | 06950075 | -0.00359198 | 0.500631 | 19.1661 |
| 1 | 06950076 | 0.493187 | 0.00385198 | 19.1503 | 06950074 | -0.000853909 | 0.497893 | 19.1555 |
| 2 | 06950072 | 0.496929 | 0.000110000 | 19.1303 | 06950071 | 0.00000 | 0.497039 | 19.0881 |
| 3 | 06950077 | 0.493700 | 0.00333899 | 19.0864 | 06950078 | -0.000404979 | 0.497444 | 19.0839 |