| Red | Green | Blue | |
| z | 17.64 | ||
| znorm | Inf | ||
| sky | -NaN | -NaN | -Inf |
| S/N | 26.1 | 43.0 | 45.4 |
| S/N(c) | 0.0 | 0.0 | 0.0 |
| SN(E/C) |
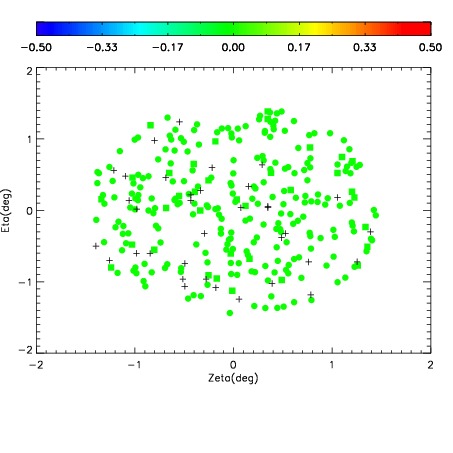
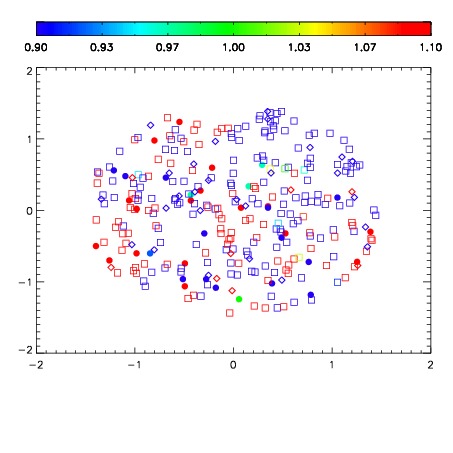
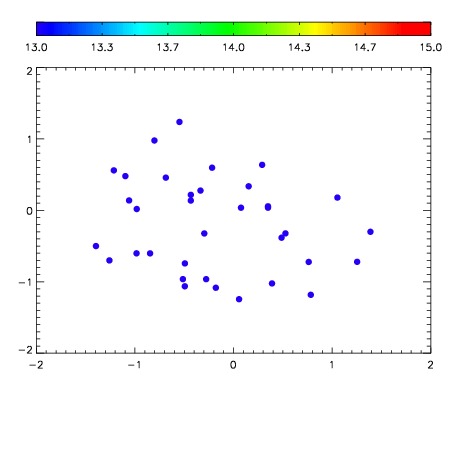

| Frame | Nreads | Zeropoints | Mag plots | Spatial mag deviation | Spatial sky 16325A emission deviations (filled: sky, open: star) | Spatial sky continuum emission | Spatial sky telluric CO2 absorption deviations (filled: H < 10) | |||||||||||||||||||||||
| 0 | 0 |
|
|
|
|
|
|
| IPAIR | NAME | SHIFT | NEWSHIFT | S/N | NAME | SHIFT | NEWSHIFT | S/N |
| 0 | 07030038 | 0.467942 | 0.00000 | 18.9610 | 07030039 | -0.000237698 | 0.468180 | 18.8643 |
| 1 | 07030042 | 0.467699 | 0.000243008 | 19.0573 | 07030043 | -0.000943196 | 0.468885 | 19.0464 |
| 2 | 07030041 | 0.466998 | 0.000943989 | 19.0289 | 07030040 | -0.00209030 | 0.470032 | 19.0106 |
| 3 | 07030037 | 0.467542 | 0.000400007 | 18.9625 | 07030036 | 0.00000 | 0.467942 | 18.9883 |