| Red | Green | Blue | |
| z | 17.64 | ||
| znorm | Inf | ||
| sky | -NaN | -NaN | -Inf |
| S/N | 23.8 | 40.9 | 42.7 |
| S/N(c) | 0.0 | 0.0 | 0.0 |
| SN(E/C) |
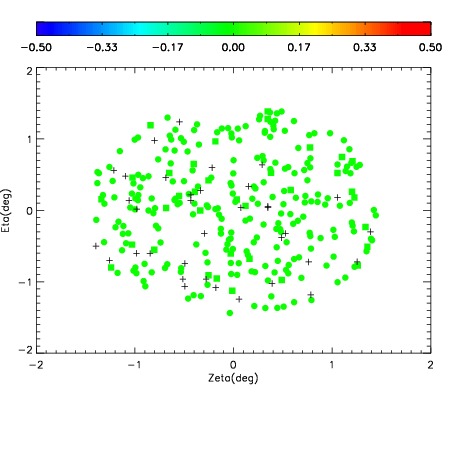
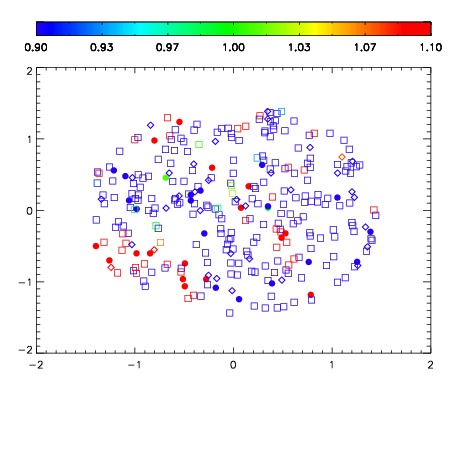


| Frame | Nreads | Zeropoints | Mag plots | Spatial mag deviation | Spatial sky 16325A emission deviations (filled: sky, open: star) | Spatial sky continuum emission | Spatial sky telluric CO2 absorption deviations (filled: H < 10) | |||||||||||||||||||||||
| 0 | 0 |
|
|
|
|
|
|
| IPAIR | NAME | SHIFT | NEWSHIFT | S/N | NAME | SHIFT | NEWSHIFT | S/N |
| 0 | 07210050 | 0.480801 | 0.00000 | 19.1377 | 07210051 | 0.00148893 | 0.479312 | 19.1278 |
| 1 | 07210049 | 0.480800 | 9.83477e-07 | 19.1074 | 07210048 | 0.00000 | 0.480801 | 19.0204 |
| 2 | 07210053 | 0.479362 | 0.00143898 | 18.6642 | 07210052 | 0.00457659 | 0.476224 | 18.9940 |
| 3 | 07210054 | 0.480638 | 0.000162989 | 18.1077 | 07210055 | -0.00177120 | 0.482572 | 18.2551 |