| Red | Green | Blue | |
| z | 17.64 | ||
| znorm | Inf | ||
| sky | -Inf | -Inf | -Inf |
| S/N | 29.5 | 50.1 | 54.0 |
| S/N(c) | 0.0 | 0.0 | 0.0 |
| SN(E/C) |
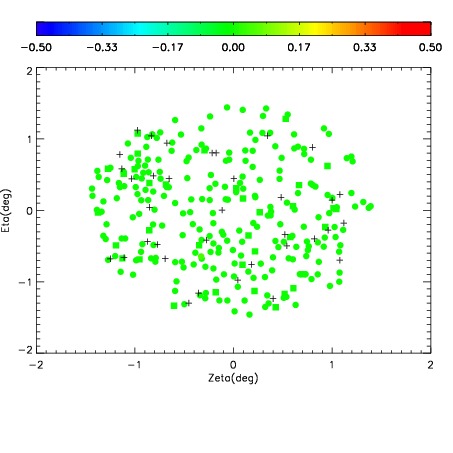
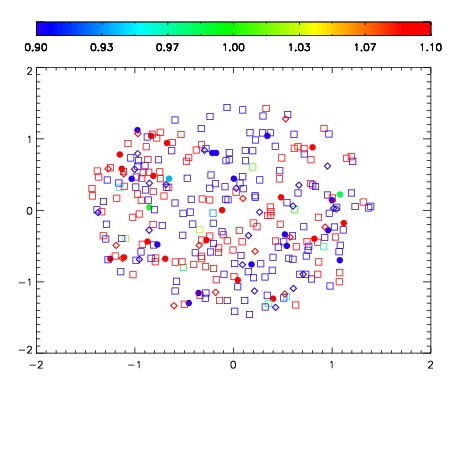
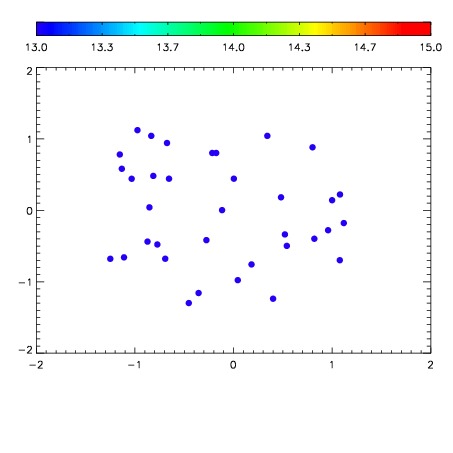

| Frame | Nreads | Zeropoints | Mag plots | Spatial mag deviation | Spatial sky 16325A emission deviations (filled: sky, open: star) | Spatial sky continuum emission | Spatial sky telluric CO2 absorption deviations (filled: H < 10) | |||||||||||||||||||||||
| 0 | 0 |
|
|
|
|
|
|
| IPAIR | NAME | SHIFT | NEWSHIFT | S/N | NAME | SHIFT | NEWSHIFT | S/N |
| 0 | 10820082 | 0.512811 | 0.00000 | 18.9966 | 10820083 | 0.0203019 | 0.492509 | 19.1344 |
| 1 | 10820081 | 0.512525 | 0.000285983 | 18.9945 | 10820076 | -0.00143869 | 0.514250 | 19.0499 |
| 2 | 10820077 | 0.483020 | 0.0297910 | 18.9403 | 10820075 | -0.00173653 | 0.514548 | 18.9785 |
| 3 | 10820078 | 0.482884 | 0.0299270 | 18.9093 | 10820079 | 0.0210851 | 0.491726 | 18.8913 |
| 4 | 10820073 | 0.480545 | 0.0322660 | 18.8773 | 10820080 | 0.0211811 | 0.491630 | 18.8420 |
| 5 | 10820074 | 0.482964 | 0.0298470 | 18.7477 | 10820072 | 0.00000 | 0.512811 | 18.6864 |