| Red | Green | Blue | |
| z | 17.64 | ||
| znorm | Inf | ||
| sky | -Inf | -Inf | -NaN |
| S/N | 7.3 | 15.5 | 14.8 |
| S/N(c) | 0.0 | 0.0 | 0.0 |
| SN(E/C) |
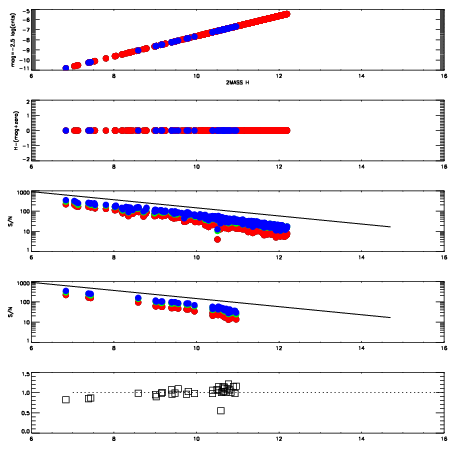


| Frame | Nreads | Zeropoints | Mag plots | Spatial mag deviation | Spatial sky 16325A emission deviations (filled: sky, open: star) | Spatial sky continuum emission | Spatial sky telluric CO2 absorption deviations (filled: H < 10) | |||||||||||||||||||||||
| 0 | 0 |
|
|
|
|
|
|
| IPAIR | NAME | SHIFT | NEWSHIFT | S/N | NAME | SHIFT | NEWSHIFT | S/N |
| 0 | 10930041 | 0.512940 | 0.00000 | 16.6486 | 10930042 | 0.000632753 | 0.512307 | 15.9897 |
| 1 | 10930040 | 0.512026 | 0.000913978 | 17.7315 | 10930039 | -0.000291966 | 0.513232 | 17.8444 |
| 2 | 10930037 | 0.512044 | 0.000895977 | 17.2137 | 10930038 | -0.000441851 | 0.513382 | 17.4595 |
| 3 | 10930045 | 0.512172 | 0.000768006 | 16.6787 | 10930046 | -0.00103217 | 0.513972 | 16.3447 |
| 4 | 10930044 | 0.512642 | 0.000297964 | 16.6717 | 10930043 | 0.000992954 | 0.511947 | 16.3363 |
| 5 | 10930036 | 0.511448 | 0.00149196 | 16.1534 | 10930035 | 0.00000 | 0.512940 | 15.1399 |