| Red | Green | Blue | |
| z | 17.64 | ||
| znorm | Inf | ||
| sky | -Inf | -Inf | -Inf |
| S/N | 14.1 | 25.4 | 27.4 |
| S/N(c) | 0.0 | 0.0 | 0.0 |
| SN(E/C) |

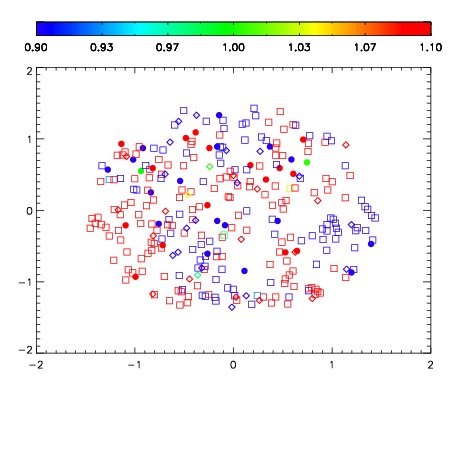


| Frame | Nreads | Zeropoints | Mag plots | Spatial mag deviation | Spatial sky 16325A emission deviations (filled: sky, open: star) | Spatial sky continuum emission | Spatial sky telluric CO2 absorption deviations (filled: H < 10) | |||||||||||||||||||||||
| 0 | 0 |
|
|
|
|
|
|
| IPAIR | NAME | SHIFT | NEWSHIFT | S/N | NAME | SHIFT | NEWSHIFT | S/N |
| 0 | 08100017 | 0.523240 | 0.00000 | 17.9419 | 08100018 | 0.000788347 | 0.522452 | 17.7463 |
| 1 | 08100012 | 0.516399 | 0.00684094 | 18.5424 | 08100011 | 0.00000 | 0.523240 | 18.5364 |
| 2 | 08100013 | 0.522845 | 0.000395000 | 18.4767 | 08100015 | -0.00111309 | 0.524353 | 18.4883 |
| 3 | 08100016 | 0.518998 | 0.00424194 | 18.2784 | 08100014 | -5.36831e-05 | 0.523294 | 18.3702 |