| Red | Green | Blue | |
| z | 17.64 | ||
| znorm | Inf | ||
| sky | -Inf | -NaN | -Inf |
| S/N | 20.8 | 37.0 | 39.6 |
| S/N(c) | 0.0 | 0.0 | 0.0 |
| SN(E/C) |
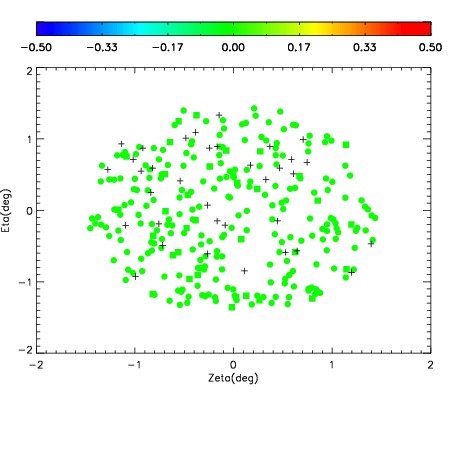
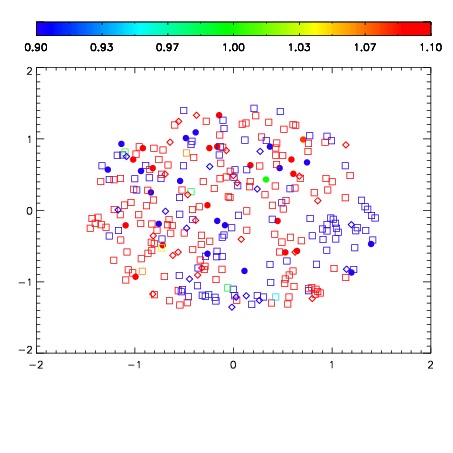
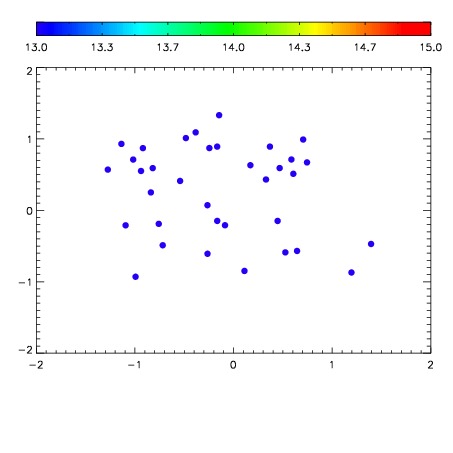

| Frame | Nreads | Zeropoints | Mag plots | Spatial mag deviation | Spatial sky 16325A emission deviations (filled: sky, open: star) | Spatial sky continuum emission | Spatial sky telluric CO2 absorption deviations (filled: H < 10) | |||||||||||||||||||||||
| 0 | 0 |
|
|
|
|
|
|
| IPAIR | NAME | SHIFT | NEWSHIFT | S/N | NAME | SHIFT | NEWSHIFT | S/N |
| 0 | 10810070 | 0.485252 | 0.00000 | 18.7367 | 10810068 | 0.000202461 | 0.485050 | 18.8313 |
| 1 | 10810066 | 0.483772 | 0.00147998 | 18.7476 | 10810069 | 0.000125250 | 0.485127 | 18.8755 |
| 2 | 10810062 | 0.482379 | 0.00287300 | 18.6494 | 10810065 | 0.000555133 | 0.484697 | 18.7843 |
| 3 | 10810063 | 0.483455 | 0.00179699 | 18.5112 | 10810064 | -0.000600436 | 0.485852 | 18.6306 |
| 4 | 10810067 | 0.483506 | 0.00174600 | 18.4823 | 10810061 | 0.00000 | 0.485252 | 18.5885 |