| Red | Green | Blue | |
| z | 17.64 | ||
| znorm | Inf | ||
| sky | -Inf | -Inf | -Inf |
| S/N | 17.5 | 31.8 | 33.8 |
| S/N(c) | 0.0 | 0.0 | 0.0 |
| SN(E/C) |
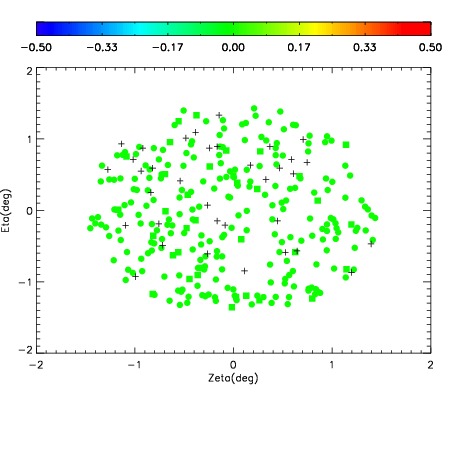
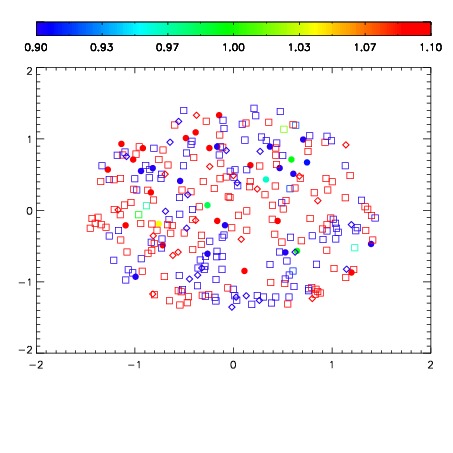


| Frame | Nreads | Zeropoints | Mag plots | Spatial mag deviation | Spatial sky 16325A emission deviations (filled: sky, open: star) | Spatial sky continuum emission | Spatial sky telluric CO2 absorption deviations (filled: H < 10) | |||||||||||||||||||||||
| 0 | 0 |
|
|
|
|
|
|
| IPAIR | NAME | SHIFT | NEWSHIFT | S/N | NAME | SHIFT | NEWSHIFT | S/N |
| 0 | 10910059 | 0.511148 | 0.00000 | 18.7246 | 10910060 | -0.00189148 | 0.513039 | 18.8071 |
| 1 | 10910062 | 0.510039 | 0.00110900 | 18.8192 | 10910057 | 0.00000 | 0.511148 | 18.8184 |
| 2 | 10910058 | 0.510795 | 0.000352979 | 18.6964 | 10910061 | -0.00166699 | 0.512815 | 18.8008 |