| Red | Green | Blue | |
| z | 17.64 | ||
| znorm | Inf | ||
| sky | -Inf | -Inf | -NaN |
| S/N | 21.2 | 38.3 | 39.5 |
| S/N(c) | 0.0 | 0.0 | 0.0 |
| SN(E/C) |
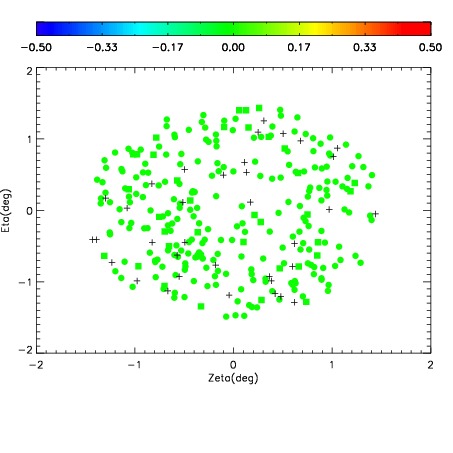
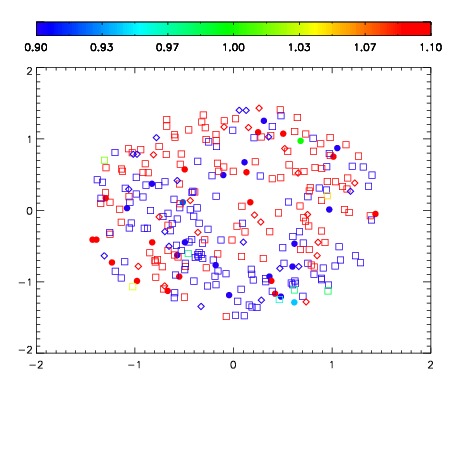


| Frame | Nreads | Zeropoints | Mag plots | Spatial mag deviation | Spatial sky 16325A emission deviations (filled: sky, open: star) | Spatial sky continuum emission | Spatial sky telluric CO2 absorption deviations (filled: H < 10) | |||||||||||||||||||||||
| 0 | 0 |
|
|
|
|
|
|
| IPAIR | NAME | SHIFT | NEWSHIFT | S/N | NAME | SHIFT | NEWSHIFT | S/N |
| 0 | 07050028 | 0.466755 | 0.00000 | 18.5573 | 07050029 | 0.000900036 | 0.465855 | 18.8303 |
| 1 | 07050032 | 0.465949 | 0.000806004 | 18.9471 | 07050030 | 0.000505225 | 0.466250 | 18.9897 |
| 2 | 07050031 | 0.465734 | 0.00102100 | 18.9312 | 07050033 | 0.00151008 | 0.465245 | 18.9287 |
| 3 | 07050027 | 0.466234 | 0.000521004 | 18.5308 | 07050026 | 0.00000 | 0.466755 | 18.4562 |