| Red | Green | Blue | |
| z | 17.64 | ||
| znorm | Inf | ||
| sky | -Inf | -Inf | -Inf |
| S/N | 20.5 | 36.7 | 38.3 |
| S/N(c) | 0.0 | 0.0 | 0.0 |
| SN(E/C) |


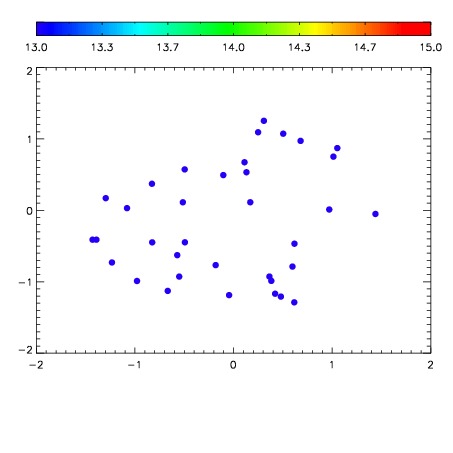

| Frame | Nreads | Zeropoints | Mag plots | Spatial mag deviation | Spatial sky 16325A emission deviations (filled: sky, open: star) | Spatial sky continuum emission | Spatial sky telluric CO2 absorption deviations (filled: H < 10) | |||||||||||||||||||||||
| 0 | 0 |
|
|
|
|
|
|
| IPAIR | NAME | SHIFT | NEWSHIFT | S/N | NAME | SHIFT | NEWSHIFT | S/N |
| 0 | 07260065 | 0.471462 | 0.00000 | 18.5022 | 07260064 | 0.00000 | 0.471462 | 18.4123 |
| 1 | 07260070 | 0.469761 | 0.00170100 | 18.8179 | 07260071 | -0.000514937 | 0.471977 | 18.8307 |
| 2 | 07260069 | 0.469071 | 0.00239101 | 18.6691 | 07260068 | -0.00467881 | 0.476141 | 18.7410 |
| 3 | 07260066 | 0.470704 | 0.000758022 | 18.5474 | 07260067 | -0.000695928 | 0.472158 | 18.6345 |