| Red | Green | Blue | |
| z | 17.64 | ||
| znorm | Inf | ||
| sky | -Inf | -Inf | -Inf |
| S/N | 33.0 | 55.5 | 58.6 |
| S/N(c) | 0.0 | 0.0 | 0.0 |
| SN(E/C) |
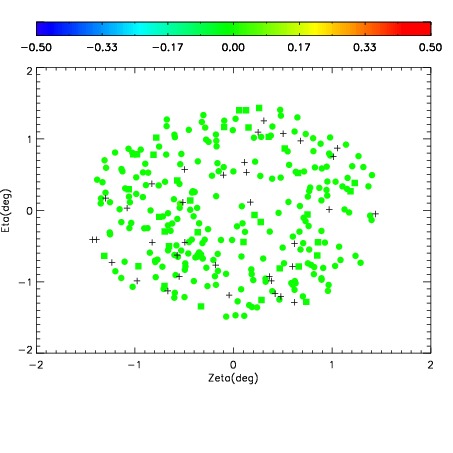
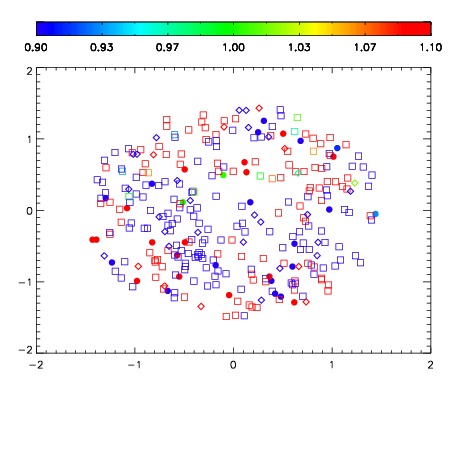


| Frame | Nreads | Zeropoints | Mag plots | Spatial mag deviation | Spatial sky 16325A emission deviations (filled: sky, open: star) | Spatial sky continuum emission | Spatial sky telluric CO2 absorption deviations (filled: H < 10) | |||||||||||||||||||||||
| 0 | 0 |
|
|
|
|
|
|
| IPAIR | NAME | SHIFT | NEWSHIFT | S/N | NAME | SHIFT | NEWSHIFT | S/N |
| 0 | 10300039 | 0.495171 | 0.00000 | 19.0334 | 10300038 | 0.00000 | 0.495171 | 19.0095 |
| 1 | 10300047 | 0.493098 | 0.00207302 | 19.2065 | 10300046 | 0.00372718 | 0.491444 | 19.1986 |
| 2 | 10300043 | 0.493208 | 0.00196302 | 19.1753 | 10300042 | 0.00200558 | 0.493165 | 19.1876 |
| 3 | 10300044 | 0.494139 | 0.00103202 | 19.1541 | 10300045 | 0.00361019 | 0.491561 | 19.1648 |
| 4 | 10300040 | 0.494472 | 0.000699013 | 19.1245 | 10300041 | 0.00211179 | 0.493059 | 19.1569 |