| Red | Green | Blue | |
| z | 17.64 | ||
| znorm | Inf | ||
| sky | -Inf | -NaN | -Inf |
| S/N | 34.5 | 58.6 | 63.0 |
| S/N(c) | 0.0 | 0.0 | 0.0 |
| SN(E/C) |
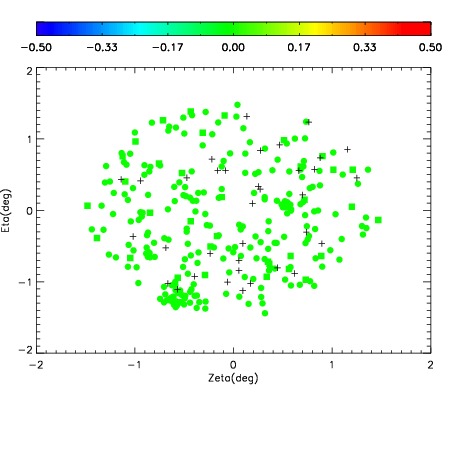
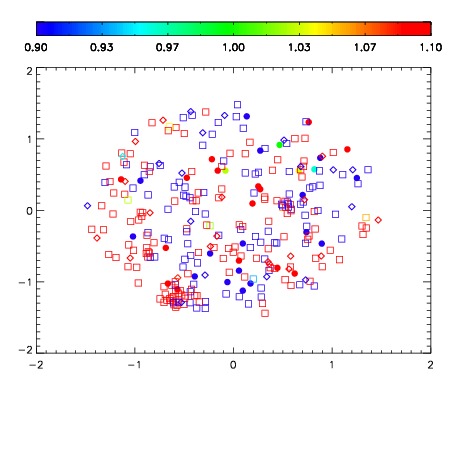


| Frame | Nreads | Zeropoints | Mag plots | Spatial mag deviation | Spatial sky 16325A emission deviations (filled: sky, open: star) | Spatial sky continuum emission | Spatial sky telluric CO2 absorption deviations (filled: H < 10) | |||||||||||||||||||||||
| 0 | 0 |
|
|
|
|
|
|
| IPAIR | NAME | SHIFT | NEWSHIFT | S/N | NAME | SHIFT | NEWSHIFT | S/N |
| 0 | 06990083 | 0.485654 | 0.00000 | 19.2117 | 06990088 | 0.00408685 | 0.481567 | 19.2019 |
| 1 | 06990087 | 0.484416 | 0.00123799 | 19.2184 | 06990084 | 0.00237894 | 0.483275 | 19.2139 |
| 2 | 06990086 | 0.480626 | 0.00502801 | 19.2081 | 06990085 | 0.00311155 | 0.482542 | 19.1778 |
| 3 | 06990082 | 0.481455 | 0.00419900 | 19.1865 | 06990081 | 0.00218856 | 0.483465 | 19.1664 |
| 4 | 06990079 | 0.483074 | 0.00257999 | 19.1435 | 06990080 | 0.00395684 | 0.481697 | 19.1265 |
| 5 | 06990078 | 0.479188 | 0.00646600 | 19.0904 | 06990077 | 0.00000 | 0.485654 | 19.0282 |