| Red | Green | Blue | |
| z | 17.64 | ||
| znorm | Inf | ||
| sky | -NaN | -Inf | -Inf |
| S/N | 31.4 | 53.1 | 56.4 |
| S/N(c) | 0.0 | 0.0 | 0.0 |
| SN(E/C) |
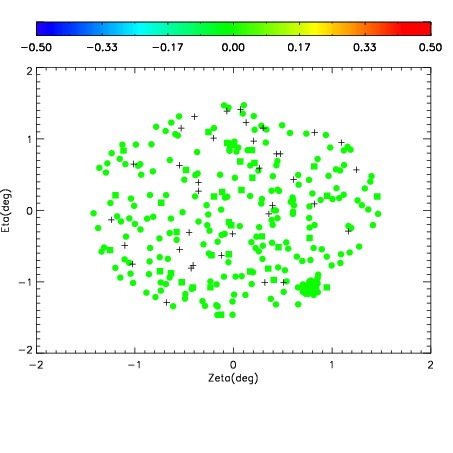
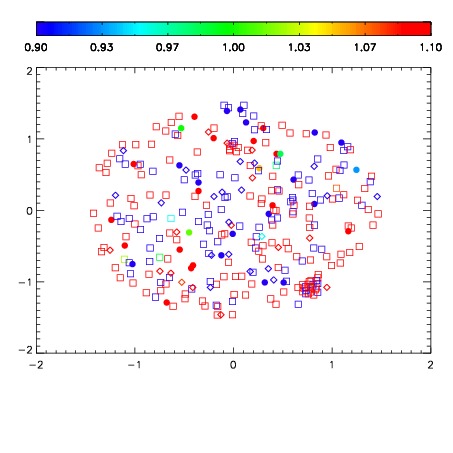


| Frame | Nreads | Zeropoints | Mag plots | Spatial mag deviation | Spatial sky 16325A emission deviations (filled: sky, open: star) | Spatial sky continuum emission | Spatial sky telluric CO2 absorption deviations (filled: H < 10) | |||||||||||||||||||||||
| 0 | 0 |
|
|
|
|
|
|
| IPAIR | NAME | SHIFT | NEWSHIFT | S/N | NAME | SHIFT | NEWSHIFT | S/N |
| 0 | 10800078 | 0.492651 | 0.00000 | 19.0111 | 10800076 | -0.000627817 | 0.493279 | 19.0101 |
| 1 | 10800082 | 0.492531 | 0.000119984 | 19.1216 | 10800080 | 0.000890296 | 0.491761 | 19.1077 |
| 2 | 10800081 | 0.491873 | 0.000777990 | 19.1078 | 10800079 | 0.000629278 | 0.492022 | 19.0518 |
| 3 | 10800074 | 0.489976 | 0.00267500 | 19.0221 | 10800075 | -0.00122688 | 0.493878 | 19.0209 |
| 4 | 10800073 | 0.489351 | 0.00329998 | 19.0055 | 10800083 | 0.00106941 | 0.491582 | 18.9974 |
| 5 | 10800077 | 0.491569 | 0.00108197 | 19.0016 | 10800072 | 0.00000 | 0.492651 | 18.9413 |