| Red | Green | Blue | |
| z | 17.64 | ||
| znorm | Inf | ||
| sky | -Inf | -NaN | -Inf |
| S/N | 30.1 | 50.8 | 55.4 |
| S/N(c) | 0.0 | 0.0 | 0.0 |
| SN(E/C) |
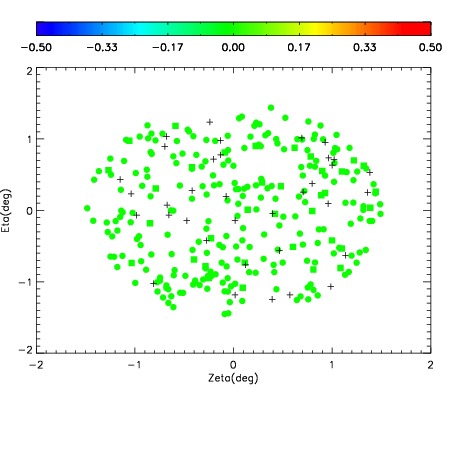
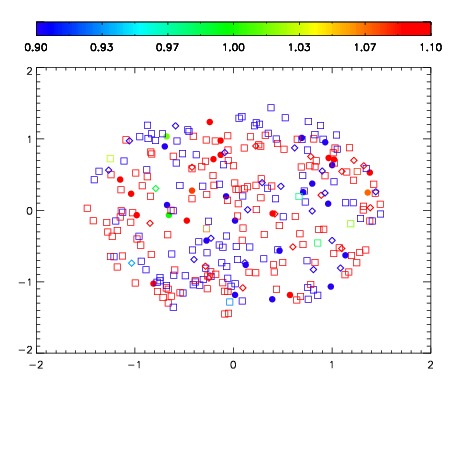


| Frame | Nreads | Zeropoints | Mag plots | Spatial mag deviation | Spatial sky 16325A emission deviations (filled: sky, open: star) | Spatial sky continuum emission | Spatial sky telluric CO2 absorption deviations (filled: H < 10) | |||||||||||||||||||||||
| 0 | 0 |
|
|
|
|
|
|
| IPAIR | NAME | SHIFT | NEWSHIFT | S/N | NAME | SHIFT | NEWSHIFT | S/N |
| 0 | 06700095 | 0.474268 | 0.00000 | 18.8368 | 06700096 | 0.00109820 | 0.473170 | 18.7697 |
| 1 | 06700086 | 0.472210 | 0.00205800 | 19.1069 | 06700085 | 0.00000 | 0.474268 | 19.0583 |
| 2 | 06700087 | 0.473538 | 0.000729978 | 19.1032 | 06700088 | 0.00262368 | 0.471644 | 19.0023 |
| 3 | 06700091 | 0.473046 | 0.00122198 | 19.0315 | 06700092 | 0.00362477 | 0.470643 | 18.9866 |
| 4 | 06700090 | 0.472048 | 0.00221997 | 18.9597 | 06700089 | 0.00266528 | 0.471603 | 18.9602 |
| 5 | 06700094 | 0.473327 | 0.000940979 | 18.9101 | 06700093 | 0.00154992 | 0.472718 | 18.9565 |