| Red | Green | Blue | |
| z | 17.64 | ||
| znorm | Inf | ||
| sky | -Inf | -Inf | -Inf |
| S/N | 19.6 | 35.0 | 37.1 |
| S/N(c) | 0.0 | 0.0 | 0.0 |
| SN(E/C) |
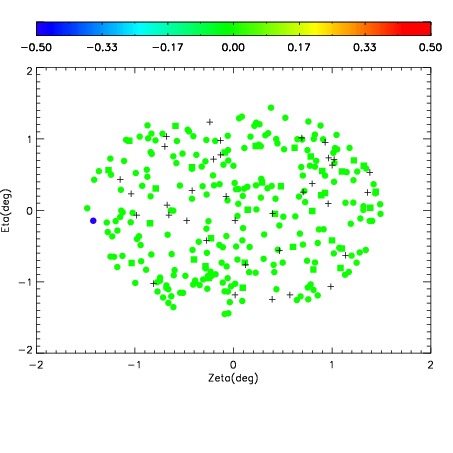
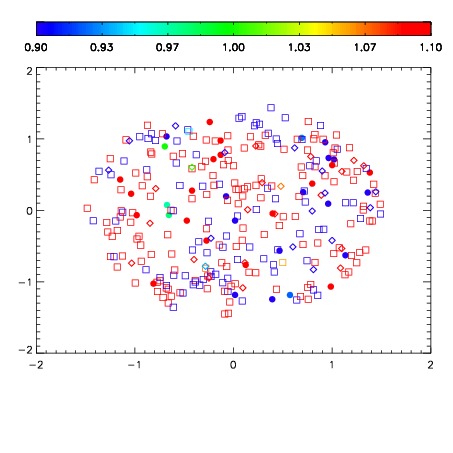


| Frame | Nreads | Zeropoints | Mag plots | Spatial mag deviation | Spatial sky 16325A emission deviations (filled: sky, open: star) | Spatial sky continuum emission | Spatial sky telluric CO2 absorption deviations (filled: H < 10) | |||||||||||||||||||||||
| 0 | 0 |
|
|
|
|
|
|
| IPAIR | NAME | SHIFT | NEWSHIFT | S/N | NAME | SHIFT | NEWSHIFT | S/N |
| 0 | 07020050 | 0.475122 | 0.00000 | 18.8365 | 07020051 | 0.00292308 | 0.472199 | 18.8118 |
| 1 | 07020049 | 0.474204 | 0.000918001 | 18.7660 | 07020052 | 0.00170936 | 0.473413 | 18.7359 |
| 2 | 07020053 | 0.472972 | 0.00215000 | 18.4225 | 07020048 | 0.00000 | 0.475122 | 18.6630 |
| 3 | 07020054 | 0.472510 | 0.00261199 | 18.1624 | 07020055 | 1.97151e-05 | 0.475102 | 18.3367 |