| Red | Green | Blue | |
| z | 17.64 | ||
| znorm | Inf | ||
| sky | -Inf | -Inf | -Inf |
| S/N | 25.6 | 43.9 | 47.1 |
| S/N(c) | 0.0 | 0.0 | 0.0 |
| SN(E/C) |
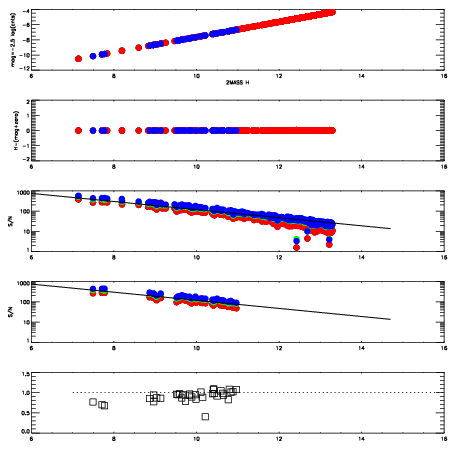
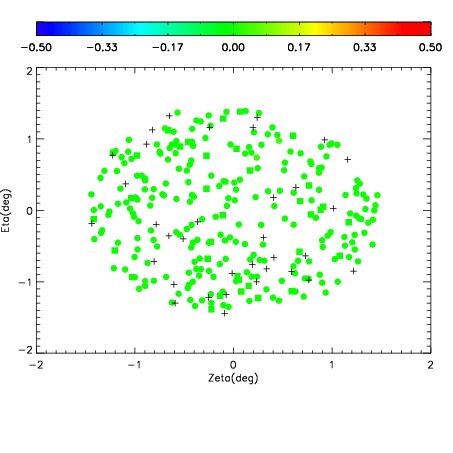
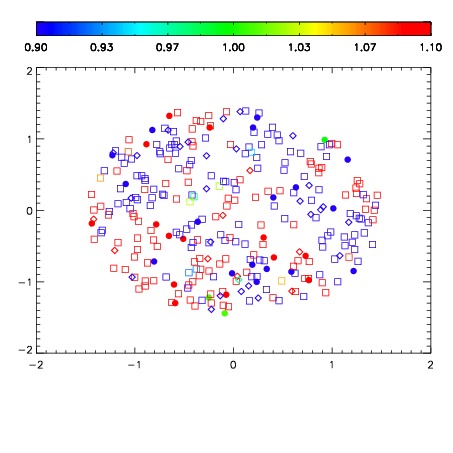
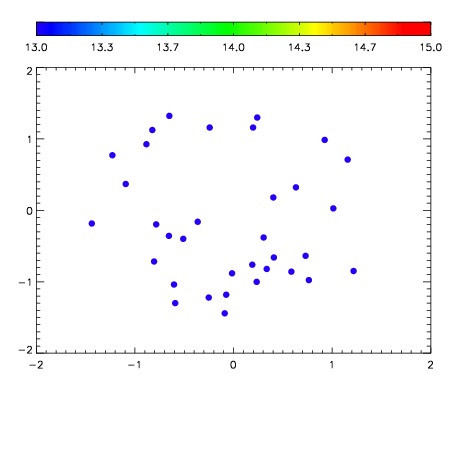

| Frame | Nreads | Zeropoints | Mag plots | Spatial mag deviation | Spatial sky 16325A emission deviations (filled: sky, open: star) | Spatial sky continuum emission | Spatial sky telluric CO2 absorption deviations (filled: H < 10) | |||||||||||||||||||||||
| 0 | 0 |
|
|
|
|
|
|
| IPAIR | NAME | SHIFT | NEWSHIFT | S/N | NAME | SHIFT | NEWSHIFT | S/N |
| 0 | 06420090 | 0.491643 | 0.00000 | 19.0115 | 06420085 | 0.00000 | 0.491643 | 19.0753 |
| 1 | 06420087 | 0.483919 | 0.00772402 | 19.0498 | 06420092 | 0.00168129 | 0.489962 | 19.1038 |
| 2 | 06420086 | 0.483983 | 0.00766000 | 18.9519 | 06420089 | 0.000655987 | 0.490987 | 19.0600 |
| 3 | 06420091 | 0.491493 | 0.000150025 | 18.8364 | 06420088 | 0.00176545 | 0.489878 | 19.0257 |