| Red | Green | Blue | |
| z | 17.64 | ||
| znorm | Inf | ||
| sky | -NaN | -Inf | -Inf |
| S/N | 24.6 | 42.6 | 46.0 |
| S/N(c) | 0.0 | 0.0 | 0.0 |
| SN(E/C) |

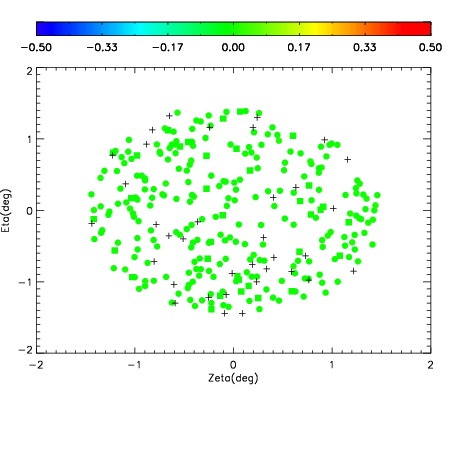


| Frame | Nreads | Zeropoints | Mag plots | Spatial mag deviation | Spatial sky 16325A emission deviations (filled: sky, open: star) | Spatial sky continuum emission | Spatial sky telluric CO2 absorption deviations (filled: H < 10) | |||||||||||||||||||||||
| 0 | 0 |
|
|
|
|
|
|
| IPAIR | NAME | SHIFT | NEWSHIFT | S/N | NAME | SHIFT | NEWSHIFT | S/N |
| 0 | 06670083 | 0.485529 | 0.00000 | 18.9877 | 06670088 | -0.00207908 | 0.487608 | 18.9603 |
| 1 | 06670082 | 0.484933 | 0.000596017 | 18.9361 | 06670084 | 0.00215012 | 0.483379 | 18.8898 |
| 2 | 06670087 | 0.484850 | 0.000679016 | 18.9333 | 06670081 | 0.00000 | 0.485529 | 18.8275 |
| 3 | 06670086 | 0.483964 | 0.00156501 | 18.9225 | 06670085 | 0.000847444 | 0.484682 | 18.8067 |