| Red | Green | Blue | |
| z | 17.64 | ||
| znorm | Inf | ||
| sky | -Inf | -NaN | -Inf |
| S/N | 25.3 | 43.0 | 46.7 |
| S/N(c) | 0.0 | 0.0 | 0.0 |
| SN(E/C) |
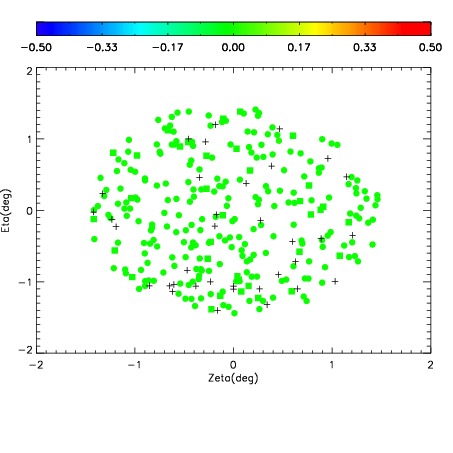
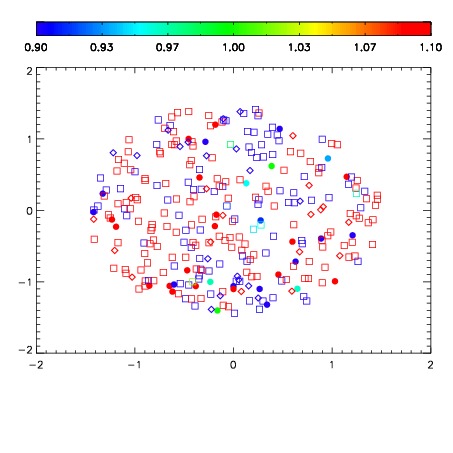


| Frame | Nreads | Zeropoints | Mag plots | Spatial mag deviation | Spatial sky 16325A emission deviations (filled: sky, open: star) | Spatial sky continuum emission | Spatial sky telluric CO2 absorption deviations (filled: H < 10) | |||||||||||||||||||||||
| 0 | 0 |
|
|
|
|
|
|
| IPAIR | NAME | SHIFT | NEWSHIFT | S/N | NAME | SHIFT | NEWSHIFT | S/N |
| 0 | 06430060 | 0.481712 | 0.00000 | 19.0250 | 06430061 | 0.00410839 | 0.477604 | 18.9422 |
| 1 | 06430064 | 0.480875 | 0.000837028 | 19.1171 | 06430065 | 0.00135408 | 0.480358 | 19.1278 |
| 2 | 06430063 | 0.481080 | 0.000632018 | 19.1015 | 06430058 | 0.00000 | 0.481712 | 19.0220 |
| 3 | 06430059 | 0.481552 | 0.000160009 | 19.0335 | 06430062 | 0.00412458 | 0.477587 | 19.0215 |