| Red | Green | Blue | |
| z | 17.64 | ||
| znorm | Inf | ||
| sky | -Inf | -NaN | -Inf |
| S/N | 26.7 | 42.8 | 47.2 |
| S/N(c) | 0.0 | 0.0 | 0.0 |
| SN(E/C) |
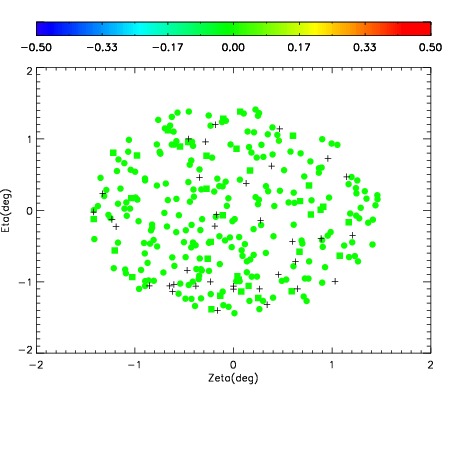
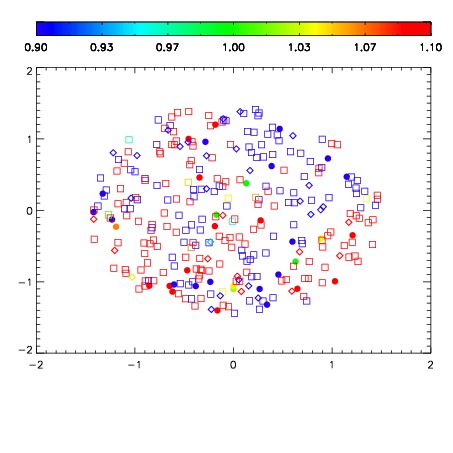
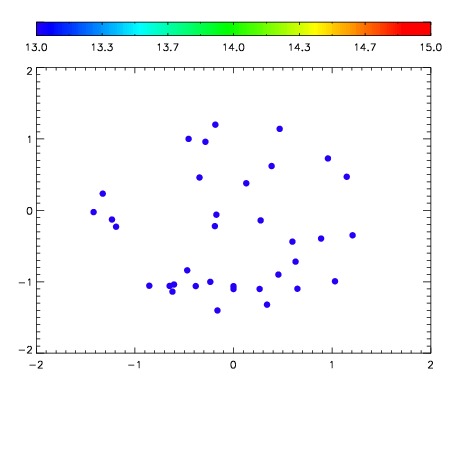

| Frame | Nreads | Zeropoints | Mag plots | Spatial mag deviation | Spatial sky 16325A emission deviations (filled: sky, open: star) | Spatial sky continuum emission | Spatial sky telluric CO2 absorption deviations (filled: H < 10) | |||||||||||||||||||||||
| 0 | 0 |
|
|
|
|
|
|
| IPAIR | NAME | SHIFT | NEWSHIFT | S/N | NAME | SHIFT | NEWSHIFT | S/N |
| 0 | 06690079 | 0.477627 | 0.00000 | 18.9915 | 06690080 | 0.00259415 | 0.475033 | 18.9950 |
| 1 | 06690075 | 0.477307 | 0.000320017 | 19.1004 | 06690077 | -0.000246845 | 0.477874 | 19.0743 |
| 2 | 06690078 | 0.477371 | 0.000256002 | 19.0658 | 06690076 | -0.00500019 | 0.482627 | 19.0458 |
| 3 | 06690074 | 0.476990 | 0.000636995 | 19.0520 | 06690073 | 0.00000 | 0.477627 | 19.0449 |