| Red | Green | Blue | |
| z | 17.64 | ||
| znorm | Inf | ||
| sky | -NaN | -Inf | -Inf |
| S/N | 28.7 | 47.6 | 50.6 |
| S/N(c) | 0.0 | 0.0 | 0.0 |
| SN(E/C) |
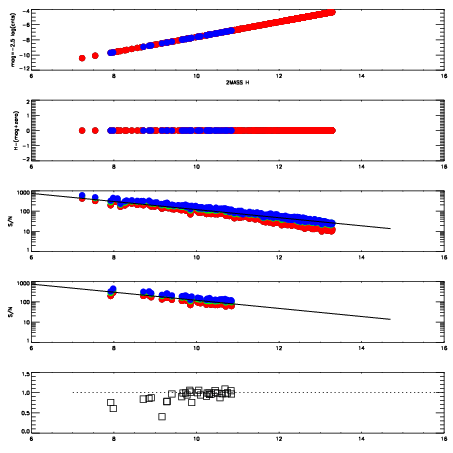
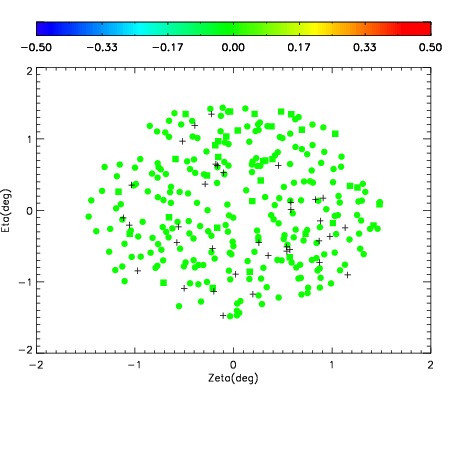
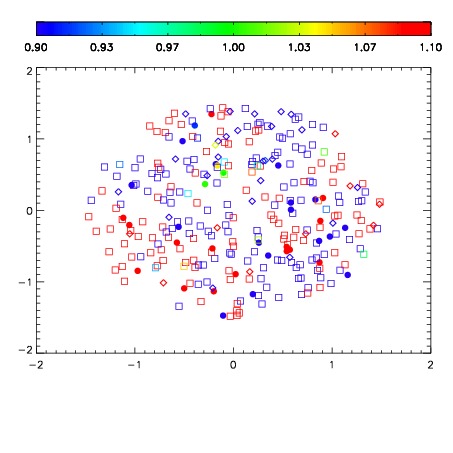
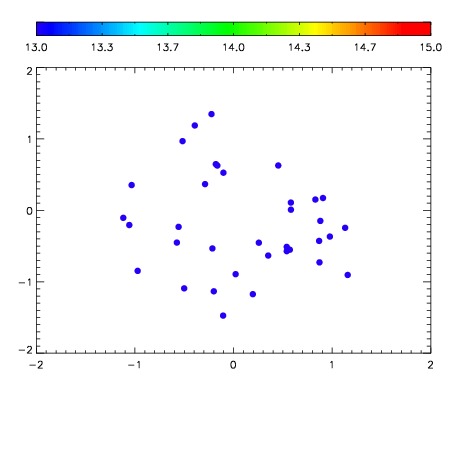

| Frame | Nreads | Zeropoints | Mag plots | Spatial mag deviation | Spatial sky 16325A emission deviations (filled: sky, open: star) | Spatial sky continuum emission | Spatial sky telluric CO2 absorption deviations (filled: H < 10) | |||||||||||||||||||||||
| 0 | 0 |
|
|
|
|
|
|
| IPAIR | NAME | SHIFT | NEWSHIFT | S/N | NAME | SHIFT | NEWSHIFT | S/N |
| 0 | 06400077 | 0.489077 | 0.00000 | 19.1244 | 06400079 | -0.000107776 | 0.489185 | 19.1736 |
| 1 | 06400080 | 0.488444 | 0.000633001 | 19.1117 | 06400082 | 0.000302346 | 0.488775 | 19.1419 |
| 2 | 06400081 | 0.488494 | 0.000582993 | 19.1104 | 06400078 | 0.00166078 | 0.487416 | 19.1242 |
| 3 | 06400076 | 0.488908 | 0.000169009 | 19.0030 | 06400075 | 0.00000 | 0.489077 | 19.1169 |