| Red | Green | Blue | |
| z | 17.64 | ||
| znorm | Inf | ||
| sky | -NaN | -Inf | -Inf |
| S/N | 28.6 | 48.6 | 52.4 |
| S/N(c) | 0.0 | 0.0 | 0.0 |
| SN(E/C) |
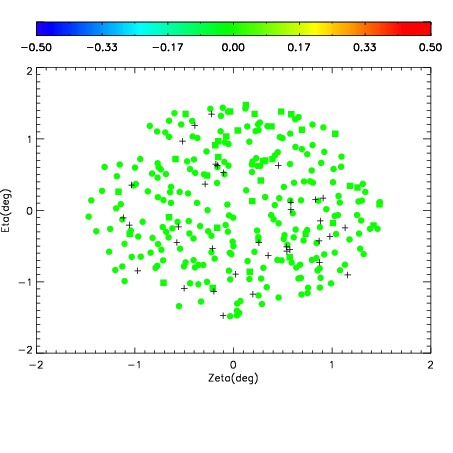
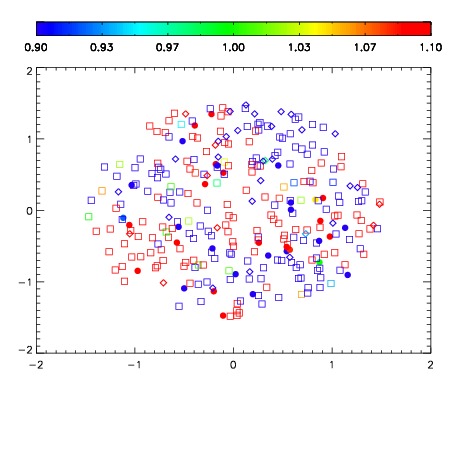


| Frame | Nreads | Zeropoints | Mag plots | Spatial mag deviation | Spatial sky 16325A emission deviations (filled: sky, open: star) | Spatial sky continuum emission | Spatial sky telluric CO2 absorption deviations (filled: H < 10) | |||||||||||||||||||||||
| 0 | 0 |
|
|
|
|
|
|
| IPAIR | NAME | SHIFT | NEWSHIFT | S/N | NAME | SHIFT | NEWSHIFT | S/N |
| 0 | 06440065 | 0.470035 | 0.00000 | 19.1525 | 06440066 | 0.000414745 | 0.469620 | 19.1937 |
| 1 | 06440060 | 0.468548 | 0.00148699 | 19.2001 | 06440062 | -0.00118179 | 0.471217 | 19.2022 |
| 2 | 06440061 | 0.469708 | 0.000326991 | 19.1975 | 06440059 | 0.00000 | 0.470035 | 19.1945 |
| 3 | 06440064 | 0.469739 | 0.000295997 | 18.8445 | 06440063 | -0.00259919 | 0.472634 | 18.8506 |