| Red | Green | Blue | |
| z | 17.64 | ||
| znorm | Inf | ||
| sky | -NaN | -NaN | -Inf |
| S/N | 28.1 | 46.4 | 51.6 |
| S/N(c) | 0.0 | 0.0 | 0.0 |
| SN(E/C) |
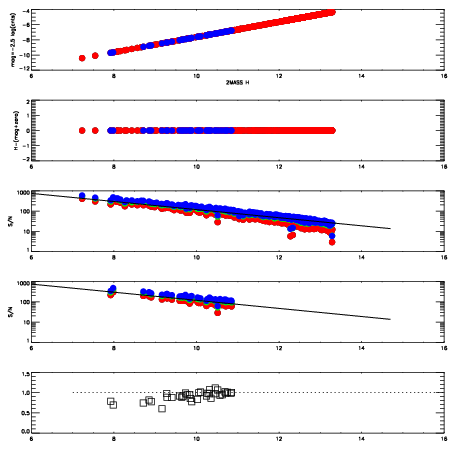
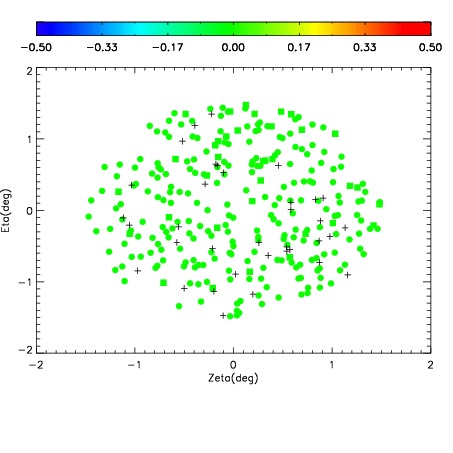
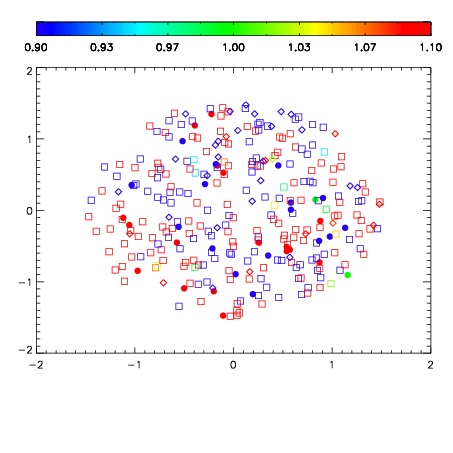
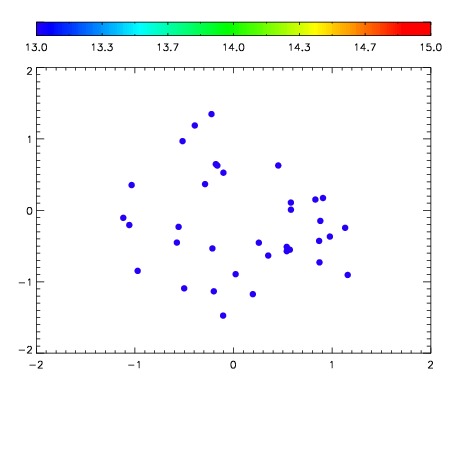

| Frame | Nreads | Zeropoints | Mag plots | Spatial mag deviation | Spatial sky 16325A emission deviations (filled: sky, open: star) | Spatial sky continuum emission | Spatial sky telluric CO2 absorption deviations (filled: H < 10) | |||||||||||||||||||||||
| 0 | 0 |
|
|
|
|
|
|
| IPAIR | NAME | SHIFT | NEWSHIFT | S/N | NAME | SHIFT | NEWSHIFT | S/N |
| 0 | 06660073 | 0.489772 | 0.00000 | 19.1242 | 06660070 | 0.00549581 | 0.484276 | 19.1021 |
| 1 | 06660072 | 0.489651 | 0.000120997 | 19.1340 | 06660071 | 0.000848007 | 0.488924 | 19.1516 |
| 2 | 06660068 | 0.488395 | 0.00137699 | 19.1128 | 06660074 | 0.00550416 | 0.484268 | 19.0896 |
| 3 | 06660069 | 0.488405 | 0.00136700 | 19.1048 | 06660067 | 0.00000 | 0.489772 | 19.0844 |