| Red | Green | Blue | |
| z | 17.64 | ||
| znorm | Inf | ||
| sky | -Inf | -NaN | -Inf |
| S/N | 15.7 | 26.8 | 30.2 |
| S/N(c) | 0.0 | 0.0 | 0.0 |
| SN(E/C) |
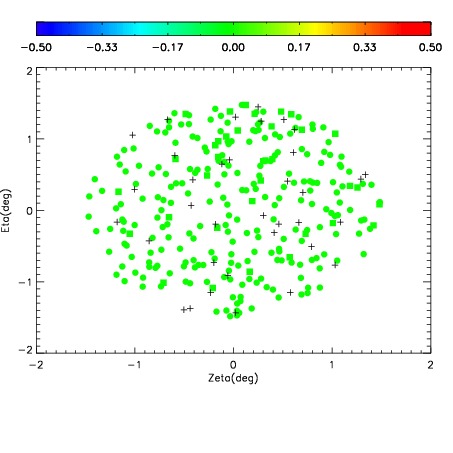
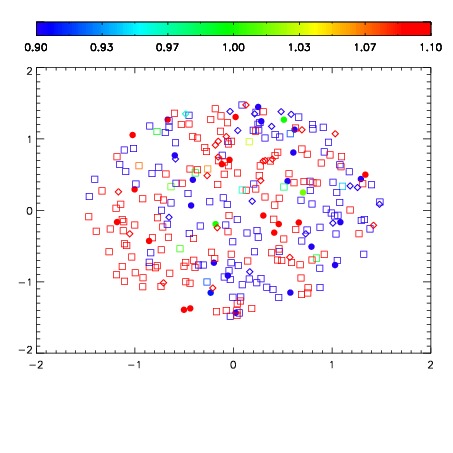
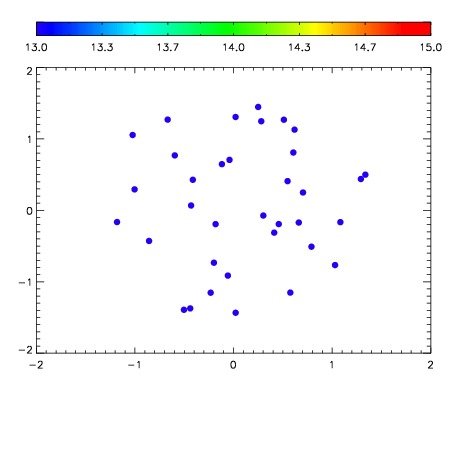

| Frame | Nreads | Zeropoints | Mag plots | Spatial mag deviation | Spatial sky 16325A emission deviations (filled: sky, open: star) | Spatial sky continuum emission | Spatial sky telluric CO2 absorption deviations (filled: H < 10) | |||||||||||||||||||||||
| 0 | 0 |
|
|
|
|
|
|
| IPAIR | NAME | SHIFT | NEWSHIFT | S/N | NAME | SHIFT | NEWSHIFT | S/N |
| 0 | 06420075 | 0.480927 | 0.00000 | 18.2599 | 06420078 | -0.00320922 | 0.484136 | 18.2271 |
| 1 | 06420080 | 0.477369 | 0.00355798 | 18.4968 | 06420081 | -0.00402558 | 0.484953 | 18.6850 |
| 2 | 06420079 | 0.477368 | 0.00355899 | 18.3981 | 06420074 | 0.00000 | 0.480927 | 18.3140 |
| 3 | 06420076 | 0.480746 | 0.000180990 | 18.2512 | 06420077 | -0.00153163 | 0.482459 | 18.2227 |