| Red | Green | Blue | |
| z | 17.64 | ||
| znorm | Inf | ||
| sky | -NaN | -NaN | -Inf |
| S/N | 28.5 | 47.2 | 53.0 |
| S/N(c) | 0.0 | 0.0 | 0.0 |
| SN(E/C) |
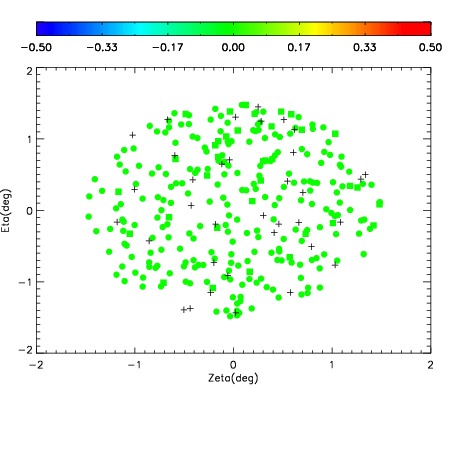
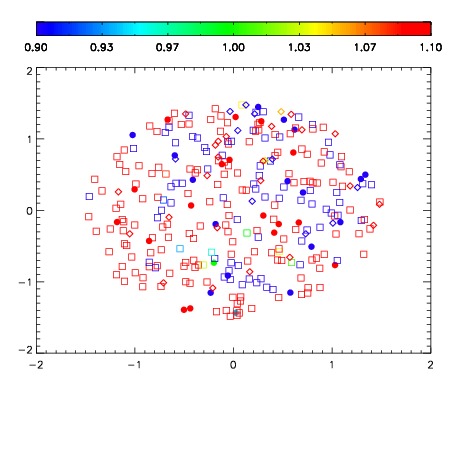
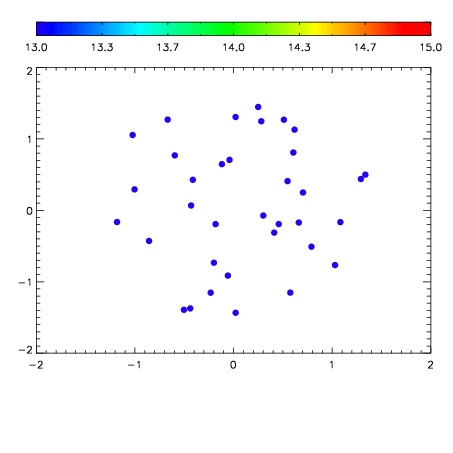

| Frame | Nreads | Zeropoints | Mag plots | Spatial mag deviation | Spatial sky 16325A emission deviations (filled: sky, open: star) | Spatial sky continuum emission | Spatial sky telluric CO2 absorption deviations (filled: H < 10) | |||||||||||||||||||||||
| 0 | 0 |
|
|
|
|
|
|
| IPAIR | NAME | SHIFT | NEWSHIFT | S/N | NAME | SHIFT | NEWSHIFT | S/N |
| 0 | 06650087 | 0.483991 | 0.00000 | 19.1017 | 06650081 | 0.00000 | 0.483991 | 19.0953 |
| 1 | 06650082 | 0.480652 | 0.00333899 | 19.0731 | 06650088 | 0.000557117 | 0.483434 | 19.0845 |
| 2 | 06650086 | 0.483400 | 0.000591010 | 19.0484 | 06650084 | 0.000700934 | 0.483290 | 19.0020 |
| 3 | 06650083 | 0.481679 | 0.00231200 | 19.0397 | 06650085 | 0.00168012 | 0.482311 | 18.9710 |