| Red | Green | Blue | |
| z | 17.64 | ||
| znorm | Inf | ||
| sky | -NaN | -Inf | -Inf |
| S/N | 26.5 | 46.3 | 48.3 |
| S/N(c) | 0.0 | 0.0 | 0.0 |
| SN(E/C) |
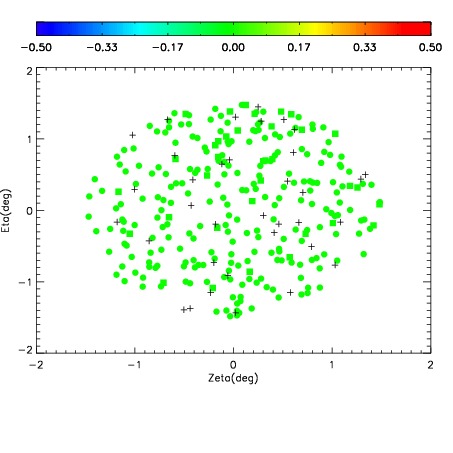
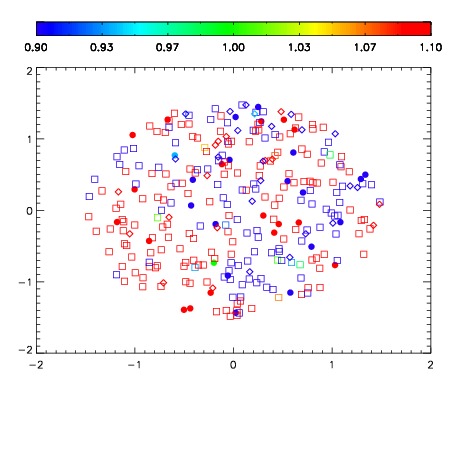
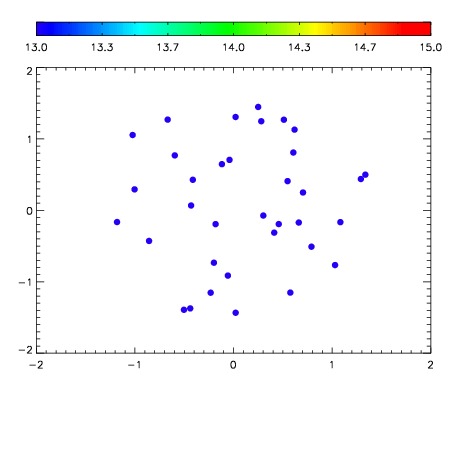

| Frame | Nreads | Zeropoints | Mag plots | Spatial mag deviation | Spatial sky 16325A emission deviations (filled: sky, open: star) | Spatial sky continuum emission | Spatial sky telluric CO2 absorption deviations (filled: H < 10) | |||||||||||||||||||||||
| 0 | 0 |
|
|
|
|
|
|
| IPAIR | NAME | SHIFT | NEWSHIFT | S/N | NAME | SHIFT | NEWSHIFT | S/N |
| 0 | 06690068 | 0.476801 | 0.00000 | 19.1158 | 06690062 | 0.00000 | 0.476801 | 19.0548 |
| 1 | 06690063 | 0.475919 | 0.000882000 | 19.1431 | 06690069 | 0.000832045 | 0.475969 | 19.1230 |
| 2 | 06690064 | 0.476345 | 0.000456005 | 19.0986 | 06690065 | 0.000413353 | 0.476388 | 19.0259 |
| 3 | 06690067 | 0.476542 | 0.000259012 | 19.0533 | 06690066 | 0.00235710 | 0.474444 | 18.9925 |