| Red | Green | Blue | |
| z | 17.63 | ||
| znorm | Inf | ||
| sky | -NaN | -NaN | -NaN |
| S/N | 24.2 | 42.0 | 44.3 |
| S/N(c) | 0.0 | 0.0 | 0.0 |
| SN(E/C) |
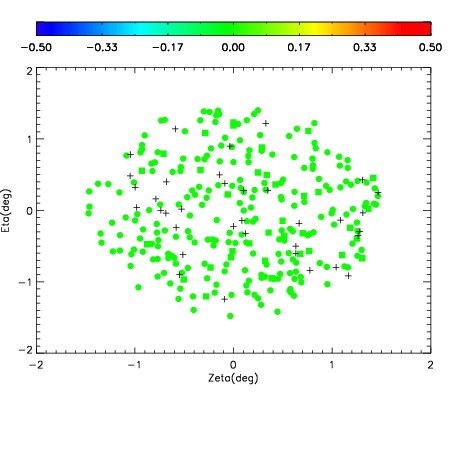

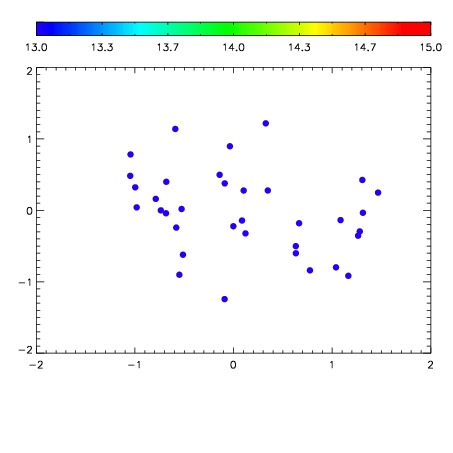

| Frame | Nreads | Zeropoints | Mag plots | Spatial mag deviation | Spatial sky 16325A emission deviations (filled: sky, open: star) | Spatial sky continuum emission | Spatial sky telluric CO2 absorption deviations (filled: H < 10) | |||||||||||||||||||||||
| 0 | 0 |
|
|
|
|
|
|
| IPAIR | NAME | SHIFT | NEWSHIFT | S/N | NAME | SHIFT | NEWSHIFT | S/N |
| 0 | 06740038 | 0.492279 | 0.00000 | 19.0435 | 06740043 | 0.00187481 | 0.490404 | 19.0717 |
| 1 | 06740042 | 0.491455 | 0.000824004 | 18.9901 | 06740039 | 0.000807102 | 0.491472 | 18.9011 |
| 2 | 06740037 | 0.491458 | 0.000820994 | 18.9427 | 06740036 | 0.00000 | 0.492279 | 18.8568 |
| 3 | 06740041 | 0.491023 | 0.00125599 | 18.8615 | 06740040 | 0.000300846 | 0.491978 | 18.7701 |