| Red | Green | Blue | |
| z | 17.64 | ||
| znorm | Inf | ||
| sky | -Inf | -Inf | -Inf |
| S/N | 21.1 | 37.2 | 38.6 |
| S/N(c) | 0.0 | 0.0 | 0.0 |
| SN(E/C) |
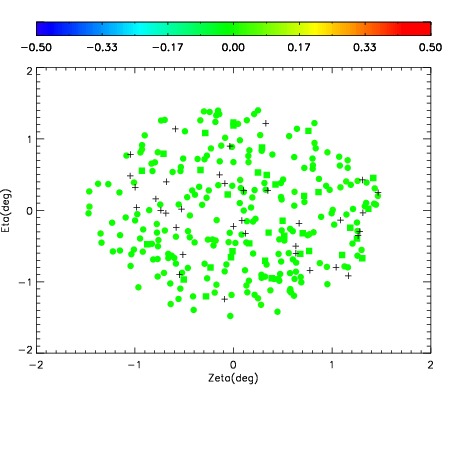
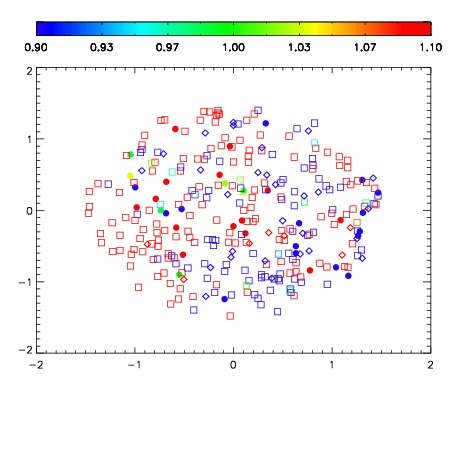


| Frame | Nreads | Zeropoints | Mag plots | Spatial mag deviation | Spatial sky 16325A emission deviations (filled: sky, open: star) | Spatial sky continuum emission | Spatial sky telluric CO2 absorption deviations (filled: H < 10) | |||||||||||||||||||||||
| 0 | 0 |
|
|
|
|
|
|
| IPAIR | NAME | SHIFT | NEWSHIFT | S/N | NAME | SHIFT | NEWSHIFT | S/N |
| 0 | 06920065 | 0.498510 | 0.00000 | 18.8780 | 06920066 | 0.00198137 | 0.496529 | 18.6879 |
| 1 | 06920064 | 0.497603 | 0.000907004 | 18.9629 | 06920063 | 0.00000 | 0.498510 | 18.9588 |
| 2 | 06920069 | 0.497279 | 0.00123101 | 18.6811 | 06920070 | 0.00319813 | 0.495312 | 18.6210 |
| 3 | 06920068 | 0.496706 | 0.00180399 | 18.3861 | 06920067 | 0.00216423 | 0.496346 | 18.4725 |