| Red | Green | Blue | |
| z | 17.63 | ||
| znorm | Inf | ||
| sky | -NaN | -NaN | -Inf |
| S/N | 30.0 | 51.3 | 53.2 |
| S/N(c) | 0.0 | 0.0 | 0.0 |
| SN(E/C) |
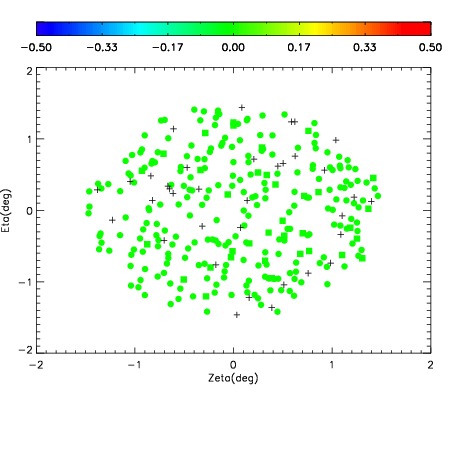
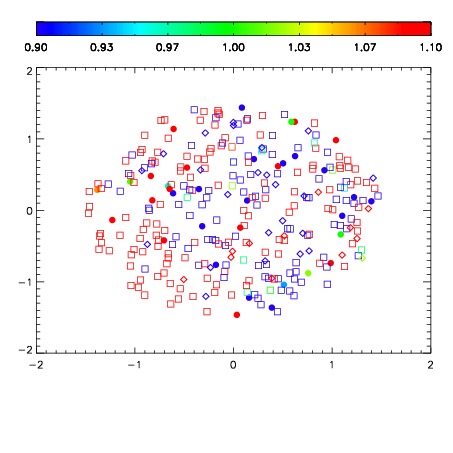


| Frame | Nreads | Zeropoints | Mag plots | Spatial mag deviation | Spatial sky 16325A emission deviations (filled: sky, open: star) | Spatial sky continuum emission | Spatial sky telluric CO2 absorption deviations (filled: H < 10) | |||||||||||||||||||||||
| 0 | 0 |
|
|
|
|
|
|
| IPAIR | NAME | SHIFT | NEWSHIFT | S/N | NAME | SHIFT | NEWSHIFT | S/N |
| 0 | 06750011 | 0.494449 | 0.00000 | 19.0465 | 06750010 | 0.00000 | 0.494449 | 18.9735 |
| 1 | 06750015 | 0.491570 | 0.00287899 | 19.1499 | 06750014 | -0.000610356 | 0.495059 | 19.1435 |
| 2 | 06750012 | 0.494438 | 1.09971e-05 | 19.1237 | 06750017 | 0.00396734 | 0.490482 | 19.1371 |
| 3 | 06750016 | 0.491633 | 0.00281599 | 19.1086 | 06750013 | 0.00201643 | 0.492433 | 19.1333 |