| Red | Green | Blue | |
| z | 17.63 | ||
| znorm | Inf | ||
| sky | -NaN | -NaN | -Inf |
| S/N | 32.3 | 54.7 | 55.7 |
| S/N(c) | 0.0 | 0.0 | 0.0 |
| SN(E/C) |


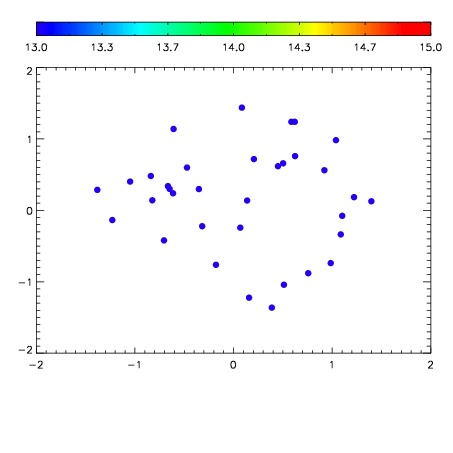

| Frame | Nreads | Zeropoints | Mag plots | Spatial mag deviation | Spatial sky 16325A emission deviations (filled: sky, open: star) | Spatial sky continuum emission | Spatial sky telluric CO2 absorption deviations (filled: H < 10) | |||||||||||||||||||||||
| 0 | 0 |
|
|
|
|
|
|
| IPAIR | NAME | SHIFT | NEWSHIFT | S/N | NAME | SHIFT | NEWSHIFT | S/N |
| 0 | 06930063 | 0.493268 | 0.00000 | 19.1686 | 06930066 | 0.00278859 | 0.490479 | 19.1525 |
| 1 | 06930067 | 0.491519 | 0.00174901 | 19.2160 | 06930065 | 0.00181664 | 0.491451 | 19.1840 |
| 2 | 06930064 | 0.492902 | 0.000366002 | 19.2010 | 06930069 | 8.46405e-06 | 0.493260 | 19.1579 |
| 3 | 06930068 | 0.491613 | 0.00165501 | 19.1561 | 06930062 | 0.00000 | 0.493268 | 19.1406 |