| Red | Green | Blue | |
| z | 17.63 | ||
| znorm | Inf | ||
| sky | -NaN | -NaN | -NaN |
| S/N | 28.0 | 44.8 | 47.4 |
| S/N(c) | 0.0 | 0.0 | 0.0 |
| SN(E/C) |

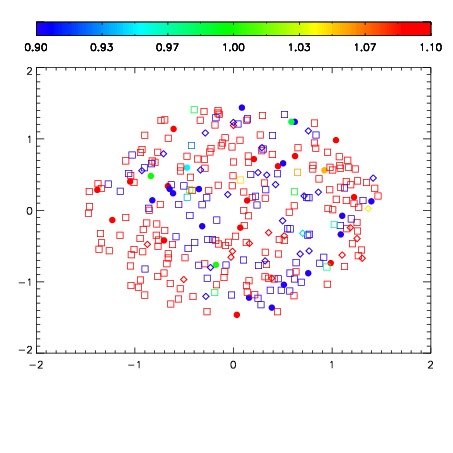


| Frame | Nreads | Zeropoints | Mag plots | Spatial mag deviation | Spatial sky 16325A emission deviations (filled: sky, open: star) | Spatial sky continuum emission | Spatial sky telluric CO2 absorption deviations (filled: H < 10) | |||||||||||||||||||||||
| 0 | 0 |
|
|
|
|
|
|
| IPAIR | NAME | SHIFT | NEWSHIFT | S/N | NAME | SHIFT | NEWSHIFT | S/N |
| 0 | 07020039 | 0.477044 | 0.00000 | 19.1064 | 07020041 | 0.00738592 | 0.469658 | 19.0230 |
| 1 | 07020038 | 0.474907 | 0.00213698 | 19.1135 | 07020040 | 0.00187500 | 0.475169 | 19.0847 |
| 2 | 07020042 | 0.474423 | 0.00262100 | 19.0804 | 07020044 | 0.00700022 | 0.470044 | 19.0220 |
| 3 | 07020043 | 0.474952 | 0.00209197 | 19.0490 | 07020037 | 0.00000 | 0.477044 | 19.0007 |