| Red | Green | Blue | |
| z | 17.64 | ||
| znorm | Inf | ||
| sky | -Inf | -Inf | -Inf |
| S/N | 18.4 | 34.8 | 36.2 |
| S/N(c) | 0.0 | 0.0 | 0.0 |
| SN(E/C) |
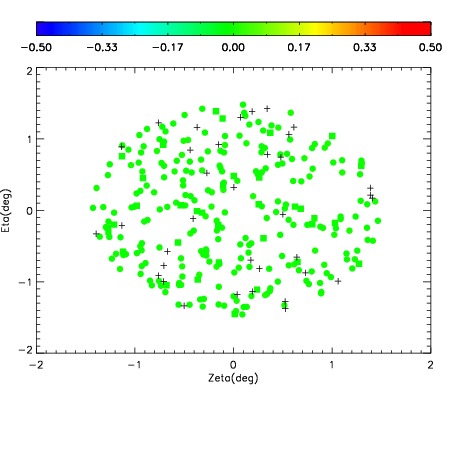
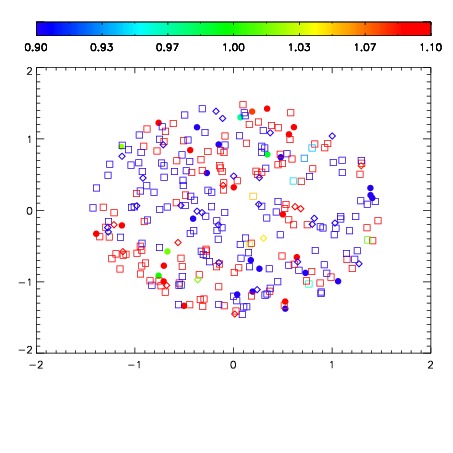
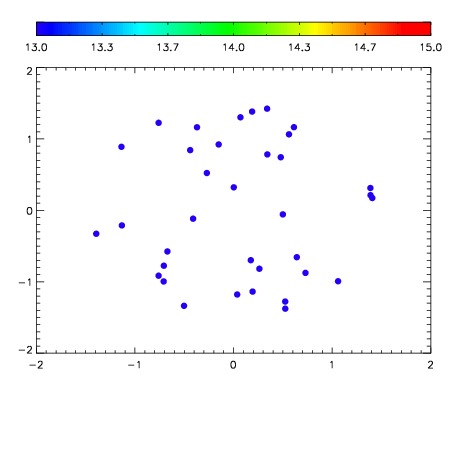

| Frame | Nreads | Zeropoints | Mag plots | Spatial mag deviation | Spatial sky 16325A emission deviations (filled: sky, open: star) | Spatial sky continuum emission | Spatial sky telluric CO2 absorption deviations (filled: H < 10) | |||||||||||||||||||||||
| 0 | 0 |
|
|
|
|
|
|
| IPAIR | NAME | SHIFT | NEWSHIFT | S/N | NAME | SHIFT | NEWSHIFT | S/N |
| 0 | 07040039 | 0.467722 | 0.00000 | 18.4514 | 07040040 | -0.00197345 | 0.469695 | 18.4690 |
| 1 | 07040042 | 0.465210 | 0.00251201 | 18.7666 | 07040041 | -0.00137374 | 0.469096 | 18.7145 |
| 2 | 07040043 | 0.465353 | 0.00236899 | 18.5815 | 07040044 | 0.00140180 | 0.466320 | 18.6076 |
| 3 | 07040038 | 0.467445 | 0.000277013 | 18.3092 | 07040037 | 0.00000 | 0.467722 | 18.3211 |