| Red | Green | Blue | |
| z | 17.64 | ||
| znorm | Inf | ||
| sky | -NaN | -Inf | -Inf |
| S/N | 25.3 | 44.2 | 47.9 |
| S/N(c) | 0.0 | 0.0 | 0.0 |
| SN(E/C) |


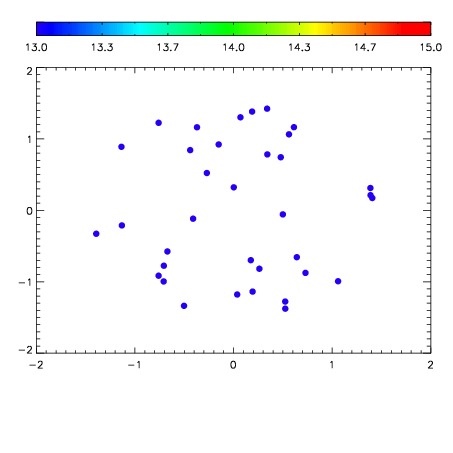

| Frame | Nreads | Zeropoints | Mag plots | Spatial mag deviation | Spatial sky 16325A emission deviations (filled: sky, open: star) | Spatial sky continuum emission | Spatial sky telluric CO2 absorption deviations (filled: H < 10) | |||||||||||||||||||||||
| 0 | 0 |
|
|
|
|
|
|
| IPAIR | NAME | SHIFT | NEWSHIFT | S/N | NAME | SHIFT | NEWSHIFT | S/N |
| 0 | 07890024 | 0.471106 | 0.00000 | 18.8166 | 07890025 | -0.00204108 | 0.473147 | 18.6243 |
| 1 | 07890028 | 0.469983 | 0.00112298 | 19.0570 | 07890029 | -0.00378989 | 0.474896 | 19.0942 |
| 2 | 07890023 | 0.471040 | 6.59823e-05 | 18.8644 | 07890022 | 0.00000 | 0.471106 | 18.7389 |
| 3 | 07890027 | 0.468981 | 0.00212499 | 18.7693 | 07890026 | -0.00596468 | 0.477071 | 18.1994 |