| Red | Green | Blue | |
| z | 17.64 | ||
| znorm | Inf | ||
| sky | -Inf | -Inf | -Inf |
| S/N | 25.3 | 42.7 | 46.2 |
| S/N(c) | 0.0 | 0.0 | 0.0 |
| SN(E/C) |
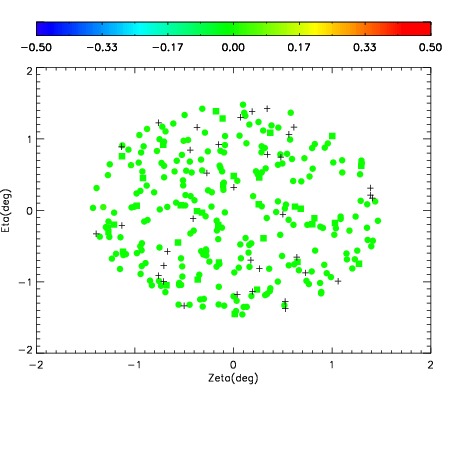

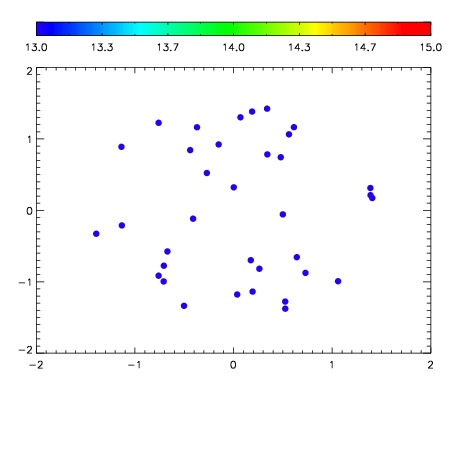

| Frame | Nreads | Zeropoints | Mag plots | Spatial mag deviation | Spatial sky 16325A emission deviations (filled: sky, open: star) | Spatial sky continuum emission | Spatial sky telluric CO2 absorption deviations (filled: H < 10) | |||||||||||||||||||||||
| 0 | 0 |
|
|
|
|
|
|
| IPAIR | NAME | SHIFT | NEWSHIFT | S/N | NAME | SHIFT | NEWSHIFT | S/N |
| 0 | 08150013 | 0.512834 | 0.00000 | 18.8208 | 08150014 | -0.000618789 | 0.513453 | 18.5111 |
| 1 | 08150012 | 0.509486 | 0.00334799 | 18.9884 | 08150011 | 0.00000 | 0.512834 | 19.0230 |
| 2 | 08150017 | 0.509411 | 0.00342304 | 18.9486 | 08150018 | -0.00201684 | 0.514851 | 18.9656 |
| 3 | 08150016 | 0.509797 | 0.00303704 | 18.8990 | 08150015 | -0.00174699 | 0.514581 | 18.7984 |