| Red | Green | Blue | |
| z | 17.64 | ||
| znorm | Inf | ||
| sky | -Inf | -Inf | -NaN |
| S/N | 28.4 | 47.6 | 51.3 |
| S/N(c) | 0.0 | 0.0 | 0.0 |
| SN(E/C) |
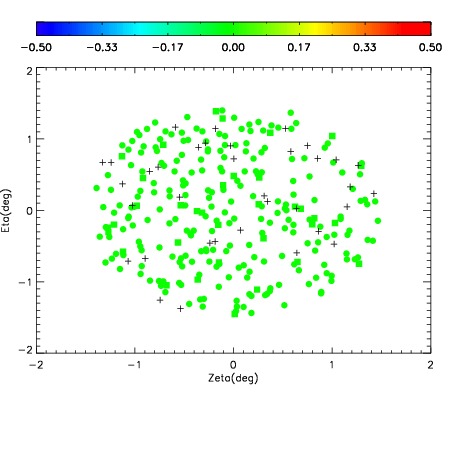
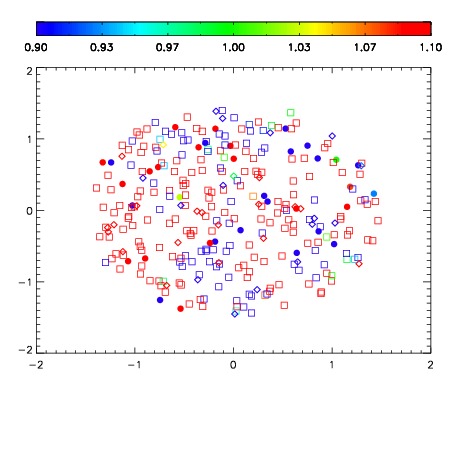
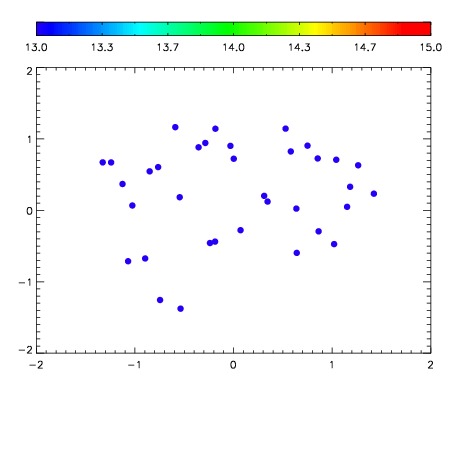

| Frame | Nreads | Zeropoints | Mag plots | Spatial mag deviation | Spatial sky 16325A emission deviations (filled: sky, open: star) | Spatial sky continuum emission | Spatial sky telluric CO2 absorption deviations (filled: H < 10) | |||||||||||||||||||||||
| 0 | 0 |
|
|
|
|
|
|
| IPAIR | NAME | SHIFT | NEWSHIFT | S/N | NAME | SHIFT | NEWSHIFT | S/N |
| 0 | 10800093 | 0.492105 | 0.00000 | 18.8039 | 10800095 | -0.00105495 | 0.493160 | 18.9170 |
| 1 | 10800088 | 0.491555 | 0.000550002 | 18.9977 | 10800087 | 0.00000 | 0.492105 | 18.9885 |
| 2 | 10800089 | 0.491915 | 0.000190020 | 18.9711 | 10800090 | -0.000327880 | 0.492433 | 18.9541 |
| 3 | 10800096 | 0.488733 | 0.00337201 | 18.8861 | 10800094 | -0.00159034 | 0.493695 | 18.9217 |
| 4 | 10800092 | 0.491741 | 0.000364006 | 18.7710 | 10800091 | -0.000439662 | 0.492545 | 18.8149 |