| Red | Green | Blue | |
| z | 17.64 | ||
| znorm | Inf | ||
| sky | -Inf | -Inf | -Inf |
| S/N | 28.2 | 48.4 | 51.7 |
| S/N(c) | 0.0 | 0.0 | 0.0 |
| SN(E/C) |
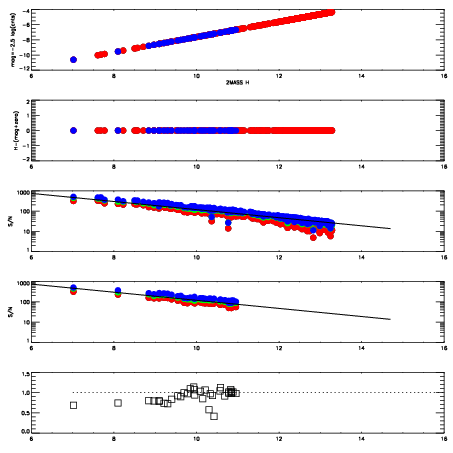
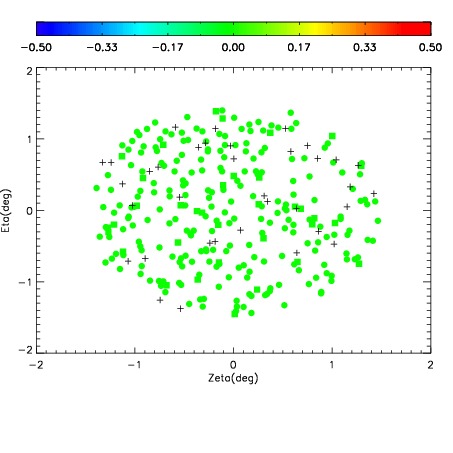
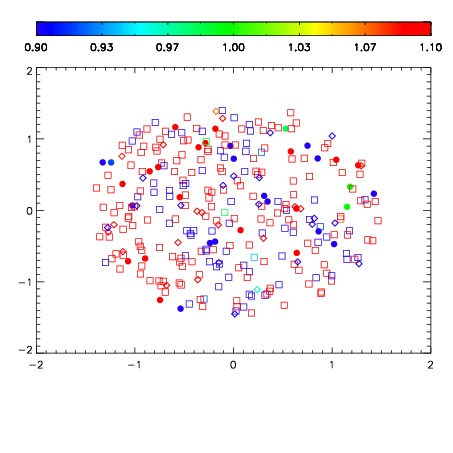
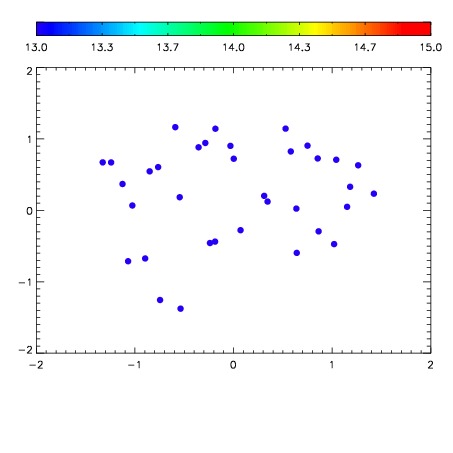

| Frame | Nreads | Zeropoints | Mag plots | Spatial mag deviation | Spatial sky 16325A emission deviations (filled: sky, open: star) | Spatial sky continuum emission | Spatial sky telluric CO2 absorption deviations (filled: H < 10) | |||||||||||||||||||||||
| 0 | 0 |
|
|
|
|
|
|
| IPAIR | NAME | SHIFT | NEWSHIFT | S/N | NAME | SHIFT | NEWSHIFT | S/N |
| 0 | 11070054 | 0.483436 | 0.00000 | 18.9808 | 11070055 | 0.00459018 | 0.478846 | 18.9958 |
| 1 | 11070050 | 0.483076 | 0.000359982 | 19.1372 | 11070048 | 0.00000 | 0.483436 | 19.1339 |
| 2 | 11070049 | 0.482382 | 0.00105399 | 19.1133 | 11070051 | 0.00332138 | 0.480115 | 19.1269 |
| 3 | 11070053 | 0.482548 | 0.000887990 | 19.0164 | 11070052 | 0.00338904 | 0.480047 | 19.0930 |