| Red | Green | Blue | |
| z | 17.64 | ||
| znorm | Inf | ||
| sky | -Inf | -Inf | -Inf |
| S/N | 30.3 | 51.1 | 53.8 |
| S/N(c) | 0.0 | 0.0 | 0.0 |
| SN(E/C) |
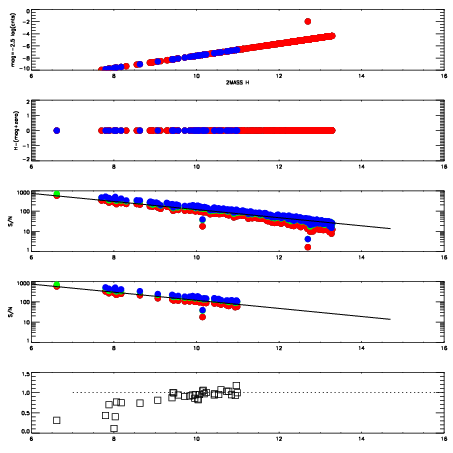
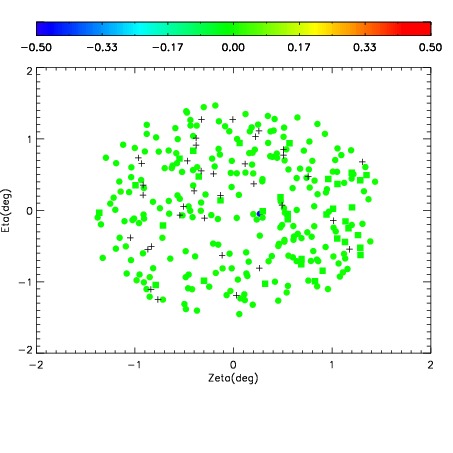
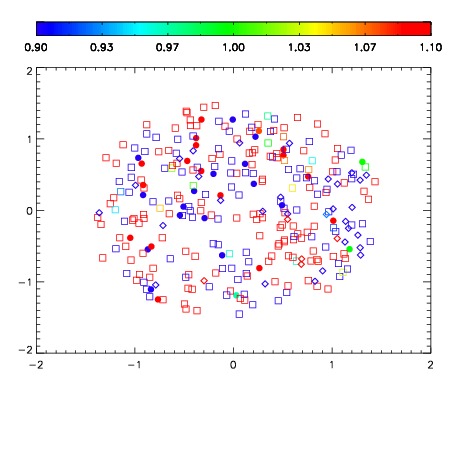
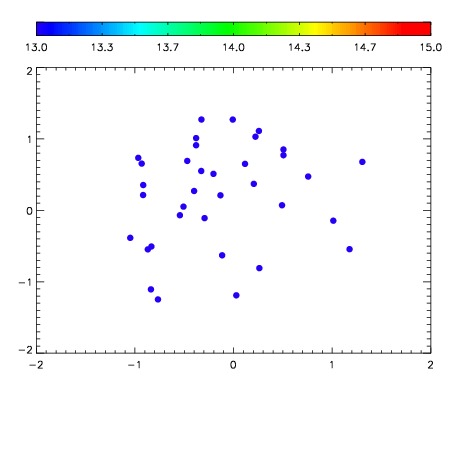

| Frame | Nreads | Zeropoints | Mag plots | Spatial mag deviation | Spatial sky 16325A emission deviations (filled: sky, open: star) | Spatial sky continuum emission | Spatial sky telluric CO2 absorption deviations (filled: H < 10) | |||||||||||||||||||||||
| 0 | 0 |
|
|
|
|
|
|
| IPAIR | NAME | SHIFT | NEWSHIFT | S/N | NAME | SHIFT | NEWSHIFT | S/N |
| 0 | 06730050 | 0.496093 | 0.00000 | 19.1357 | 06730052 | 0.00403186 | 0.492061 | 19.1390 |
| 1 | 06730054 | 0.494007 | 0.00208601 | 19.2157 | 06730055 | 0.00199381 | 0.494099 | 19.2240 |
| 2 | 06730053 | 0.491936 | 0.00415701 | 19.2004 | 06730048 | 0.00000 | 0.496093 | 19.2000 |
| 3 | 06730049 | 0.494776 | 0.00131699 | 19.1544 | 06730051 | 0.00164095 | 0.494452 | 19.1411 |