| Red | Green | Blue | |
| z | 17.64 | ||
| znorm | Inf | ||
| sky | -Inf | -Inf | -NaN |
| S/N | 21.0 | 36.7 | 39.2 |
| S/N(c) | 0.0 | 0.0 | 0.0 |
| SN(E/C) |
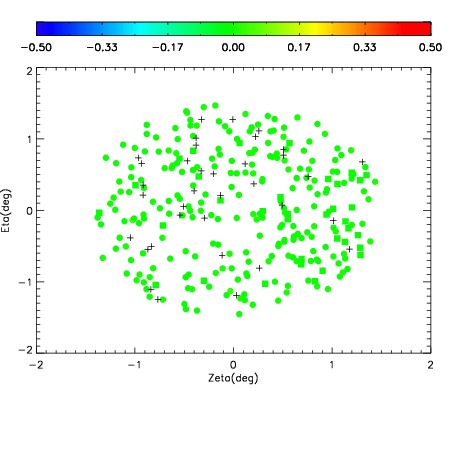
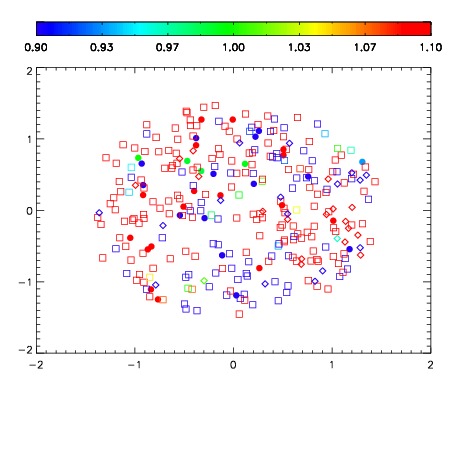
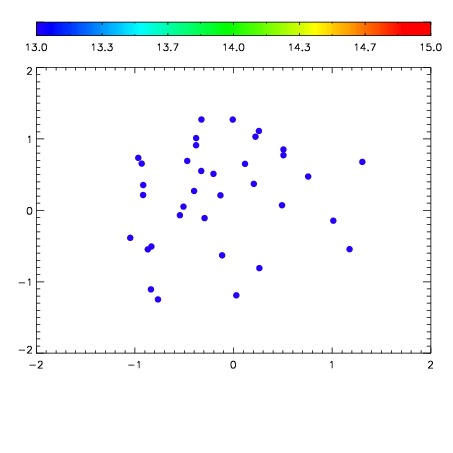

| Frame | Nreads | Zeropoints | Mag plots | Spatial mag deviation | Spatial sky 16325A emission deviations (filled: sky, open: star) | Spatial sky continuum emission | Spatial sky telluric CO2 absorption deviations (filled: H < 10) | |||||||||||||||||||||||
| 0 | 0 |
|
|
|
|
|
|
| IPAIR | NAME | SHIFT | NEWSHIFT | S/N | NAME | SHIFT | NEWSHIFT | S/N |
| 0 | 06770027 | 0.484748 | 0.00000 | 18.5925 | 06770025 | 0.00000 | 0.484748 | 18.8673 |
| 1 | 06770031 | 0.483905 | 0.000843018 | 18.6926 | 06770032 | 0.00183947 | 0.482909 | 18.9506 |
| 2 | 06770026 | 0.483885 | 0.000863016 | 18.6779 | 06770028 | -0.00314545 | 0.487893 | 18.8863 |
| 3 | 06770030 | 0.483304 | 0.00144401 | 18.4789 | 06770029 | -0.00216666 | 0.486915 | 18.7616 |