| Red | Green | Blue | |
| z | 17.64 | ||
| znorm | Inf | ||
| sky | -NaN | -NaN | -Inf |
| S/N | 26.9 | 46.0 | 48.4 |
| S/N(c) | 0.0 | 0.0 | 0.0 |
| SN(E/C) |
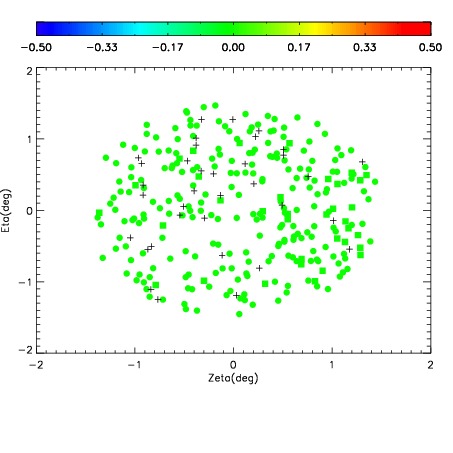
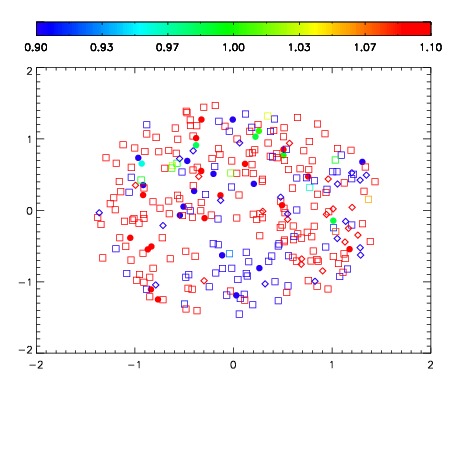
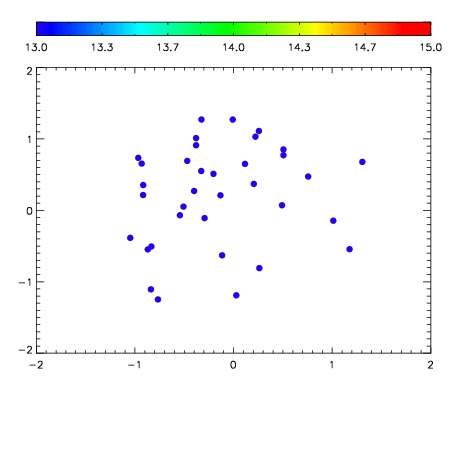

| Frame | Nreads | Zeropoints | Mag plots | Spatial mag deviation | Spatial sky 16325A emission deviations (filled: sky, open: star) | Spatial sky continuum emission | Spatial sky telluric CO2 absorption deviations (filled: H < 10) | |||||||||||||||||||||||
| 0 | 0 |
|
|
|
|
|
|
| IPAIR | NAME | SHIFT | NEWSHIFT | S/N | NAME | SHIFT | NEWSHIFT | S/N |
| 0 | 07000077 | 0.484282 | 0.00000 | 19.1138 | 07000076 | 0.00258439 | 0.481698 | 19.1106 |
| 1 | 07000074 | 0.484122 | 0.000159979 | 19.1770 | 07000075 | 0.00262848 | 0.481654 | 19.1459 |
| 2 | 07000078 | 0.484280 | 1.99676e-06 | 19.1053 | 07000079 | 0.00423979 | 0.480042 | 19.0927 |
| 3 | 07000073 | 0.483537 | 0.000744998 | 19.0871 | 07000072 | 0.00000 | 0.484282 | 19.0349 |