| Red | Green | Blue | |
| z | 17.64 | ||
| znorm | Inf | ||
| sky | -Inf | -Inf | -Inf |
| S/N | 17.1 | 30.9 | 33.1 |
| S/N(c) | 0.0 | 0.0 | 0.0 |
| SN(E/C) |
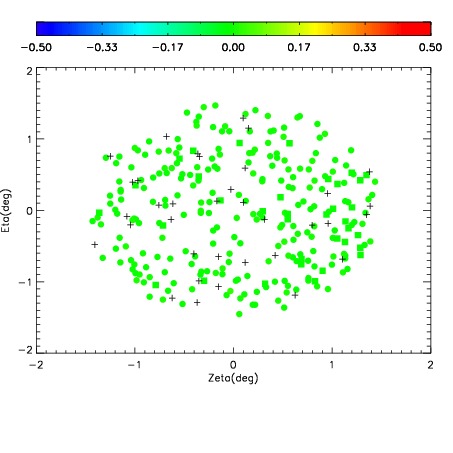
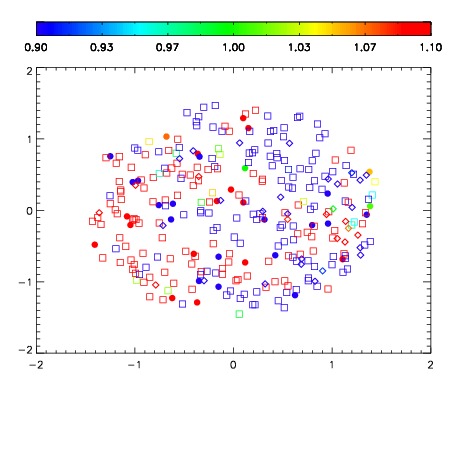
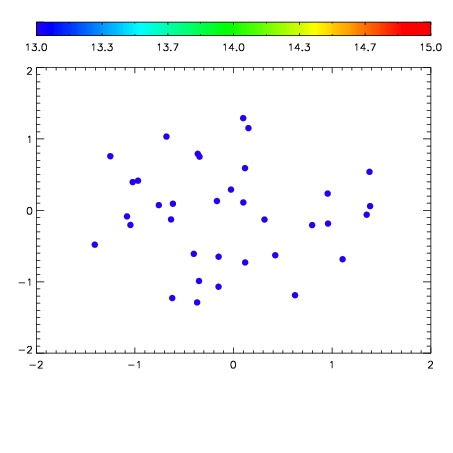

| Frame | Nreads | Zeropoints | Mag plots | Spatial mag deviation | Spatial sky 16325A emission deviations (filled: sky, open: star) | Spatial sky continuum emission | Spatial sky telluric CO2 absorption deviations (filled: H < 10) | |||||||||||||||||||||||
| 0 | 0 |
|
|
|
|
|
|
| IPAIR | NAME | SHIFT | NEWSHIFT | S/N | NAME | SHIFT | NEWSHIFT | S/N |
| 0 | 06920076 | 0.497437 | 0.00000 | 18.6236 | 06920074 | 0.00000 | 0.497437 | 18.6836 |
| 1 | 06920075 | 0.497191 | 0.000245988 | 18.5742 | 06920077 | 0.00381558 | 0.493621 | 18.5142 |
| 2 | 06920080 | 0.493077 | 0.00435999 | 18.3717 | 06920081 | 0.00530353 | 0.492133 | 18.1489 |
| 3 | 06920079 | 0.492468 | 0.00496900 | 18.2912 | 06920078 | 0.00176911 | 0.495668 | 18.0804 |