| Red | Green | Blue | |
| z | 17.64 | ||
| znorm | Inf | ||
| sky | -Inf | -Inf | -Inf |
| S/N | 15.5 | 29.3 | 32.9 |
| S/N(c) | 0.0 | 0.0 | 0.0 |
| SN(E/C) |
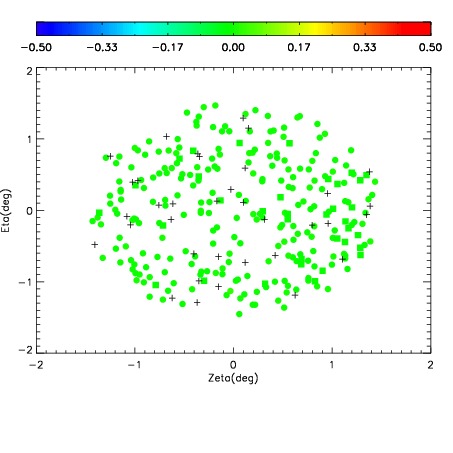
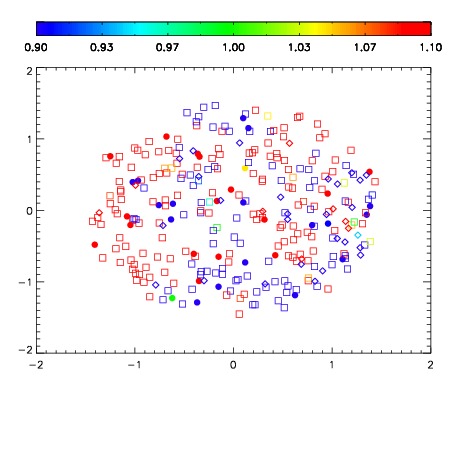


| Frame | Nreads | Zeropoints | Mag plots | Spatial mag deviation | Spatial sky 16325A emission deviations (filled: sky, open: star) | Spatial sky continuum emission | Spatial sky telluric CO2 absorption deviations (filled: H < 10) | |||||||||||||||||||||||
| 0 | 0 |
|
|
|
|
|
|
| IPAIR | NAME | SHIFT | NEWSHIFT | S/N | NAME | SHIFT | NEWSHIFT | S/N |
| 0 | 07200054 | 0.472009 | 0.00000 | 18.4265 | 07200051 | -0.00618289 | 0.478192 | 18.4959 |
| 1 | 07200053 | 0.470243 | 0.00176600 | 18.6101 | 07200052 | -0.00765671 | 0.479666 | 18.6909 |
| 2 | 07200050 | 0.470175 | 0.00183401 | 17.7646 | 07200048 | 0.00000 | 0.472009 | 18.3539 |
| 3 | 07200049 | 0.469512 | 0.00249702 | 17.7162 | 07200055 | -0.00561858 | 0.477628 | 17.7766 |