| Red | Green | Blue | |
| z | 17.64 | ||
| znorm | Inf | ||
| sky | -Inf | -Inf | -Inf |
| S/N | 36.7 | 61.0 | 67.5 |
| S/N(c) | 0.0 | 0.0 | 0.0 |
| SN(E/C) |

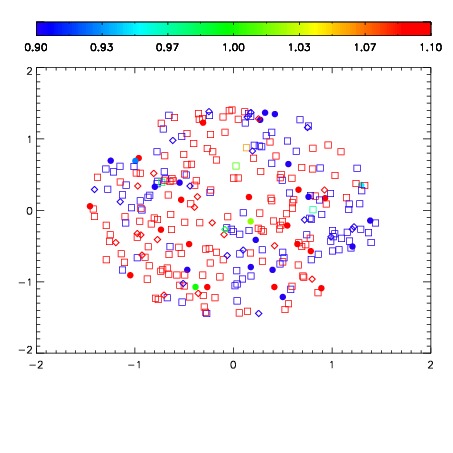
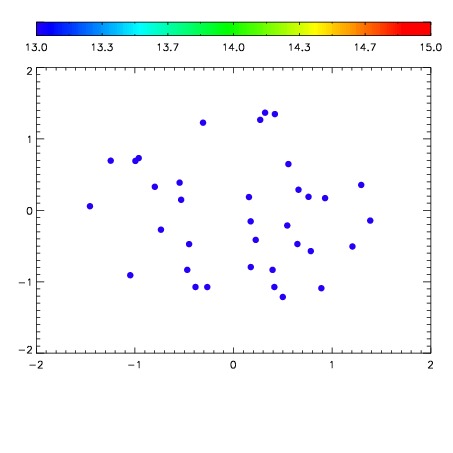

| Frame | Nreads | Zeropoints | Mag plots | Spatial mag deviation | Spatial sky 16325A emission deviations (filled: sky, open: star) | Spatial sky continuum emission | Spatial sky telluric CO2 absorption deviations (filled: H < 10) | |||||||||||||||||||||||
| 0 | 0 |
|
|
|
|
|
|
| IPAIR | NAME | SHIFT | NEWSHIFT | S/N | NAME | SHIFT | NEWSHIFT | S/N |
| 0 | 06980085 | 0.481929 | 0.00000 | 19.1807 | 06980086 | 0.00360880 | 0.478320 | 19.1983 |
| 1 | 06980088 | 0.477470 | 0.00445899 | 19.1857 | 06980087 | 0.00361985 | 0.478309 | 19.2086 |
| 2 | 06980084 | 0.478305 | 0.00362399 | 19.1699 | 06980083 | 0.00000 | 0.481929 | 19.1727 |
| 3 | 06980092 | 0.478507 | 0.00342199 | 19.1575 | 06980090 | 0.000440879 | 0.481488 | 19.1683 |
| 4 | 06980093 | 0.479987 | 0.00194201 | 19.1531 | 06980094 | -0.00102085 | 0.482950 | 19.1657 |
| 5 | 06980089 | 0.480966 | 0.000963002 | 19.1425 | 06980091 | -0.00183345 | 0.483762 | 19.1474 |