| Red | Green | Blue | |
| z | 17.64 | ||
| znorm | Inf | ||
| sky | -Inf | -Inf | -Inf |
| S/N | 28.7 | 48.2 | 52.0 |
| S/N(c) | 0.0 | 0.0 | 0.0 |
| SN(E/C) |
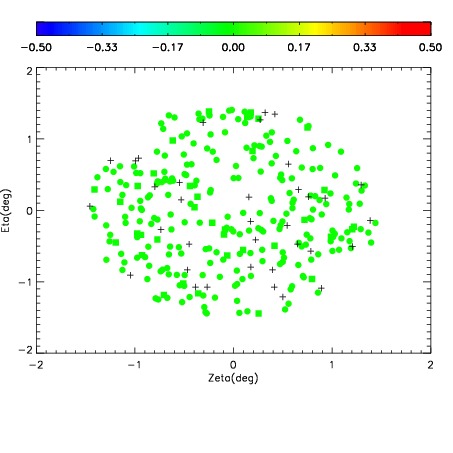
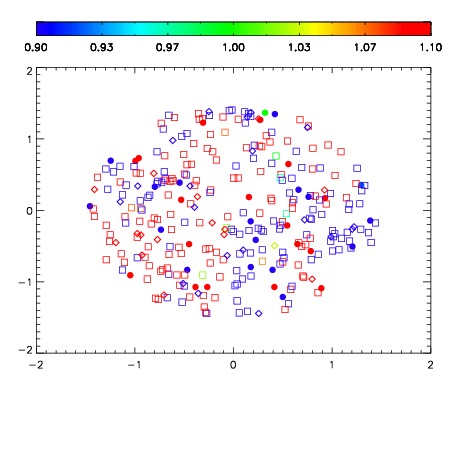
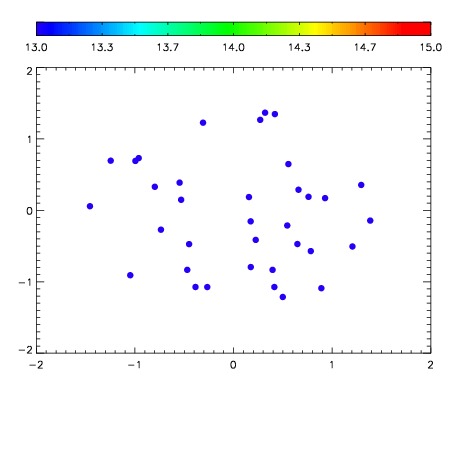

| Frame | Nreads | Zeropoints | Mag plots | Spatial mag deviation | Spatial sky 16325A emission deviations (filled: sky, open: star) | Spatial sky continuum emission | Spatial sky telluric CO2 absorption deviations (filled: H < 10) | |||||||||||||||||||||||
| 0 | 0 |
|
|
|
|
|
|
| IPAIR | NAME | SHIFT | NEWSHIFT | S/N | NAME | SHIFT | NEWSHIFT | S/N |
| 0 | 07050043 | 0.467158 | 0.00000 | 19.0178 | 07050037 | 0.00000 | 0.467158 | 18.9892 |
| 1 | 07050039 | 0.465415 | 0.00174299 | 19.1613 | 07050044 | 0.00149752 | 0.465660 | 19.1222 |
| 2 | 07050038 | 0.463483 | 0.00367498 | 19.1228 | 07050040 | 0.00194216 | 0.465216 | 19.1037 |
| 3 | 07050042 | 0.466309 | 0.000848979 | 19.0539 | 07050041 | 0.00308708 | 0.464071 | 19.0771 |