| Red | Green | Blue | |
| z | 17.63 | ||
| znorm | Inf | ||
| sky | -NaN | -NaN | -Inf |
| S/N | 2.2 | 3.3 | 4.3 |
| S/N(c) | 0.0 | 0.0 | 0.0 |
| SN(E/C) |
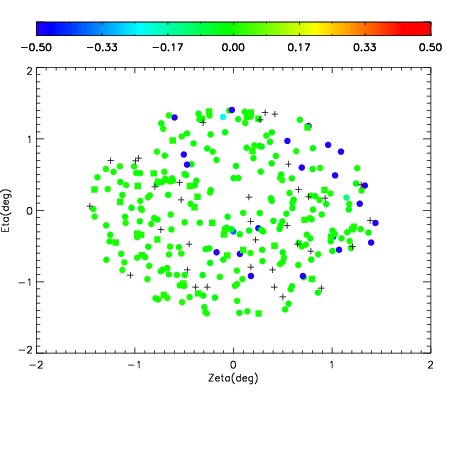
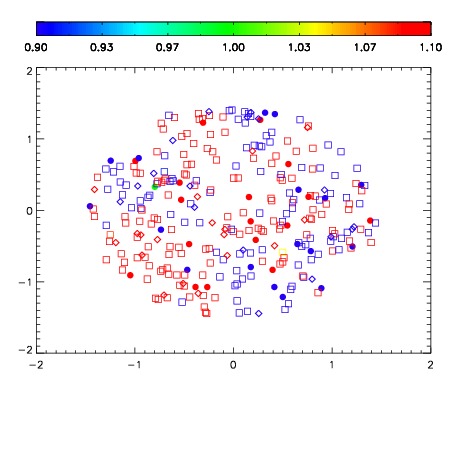
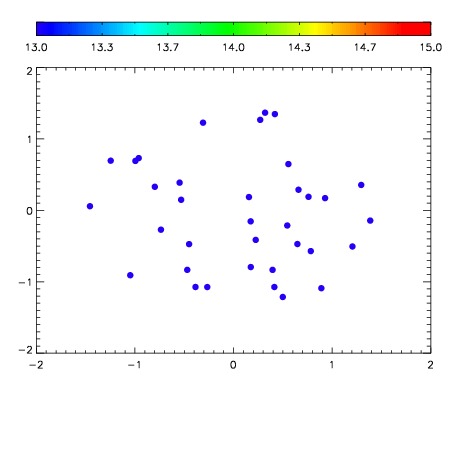

| Frame | Nreads | Zeropoints | Mag plots | Spatial mag deviation | Spatial sky 16325A emission deviations (filled: sky, open: star) | Spatial sky continuum emission | Spatial sky telluric CO2 absorption deviations (filled: H < 10) | |||||||||||||||||||||||
| 0 | 0 |
|
|
|
|
|
|
| IPAIR | NAME | SHIFT | NEWSHIFT | S/N | NAME | SHIFT | NEWSHIFT | S/N |
| 0 | 07260076 | 0.472127 | 0.00000 | 16.0236 | 07260082 | 0.00252154 | 0.469605 | 17.1131 |
| 1 | 07260077 | 0.471819 | 0.000307977 | 16.5672 | 07260079 | 0.00294384 | 0.469183 | 17.3787 |
| 2 | 07260080 | 0.471479 | 0.000647992 | 15.7745 | 07260078 | 0.00121562 | 0.470911 | 16.9548 |