| Red | Green | Blue | |
| z | 17.64 | ||
| znorm | Inf | ||
| sky | -Inf | -Inf | -Inf |
| S/N | 32.5 | 53.5 | 59.3 |
| S/N(c) | 0.0 | 0.0 | 0.0 |
| SN(E/C) |
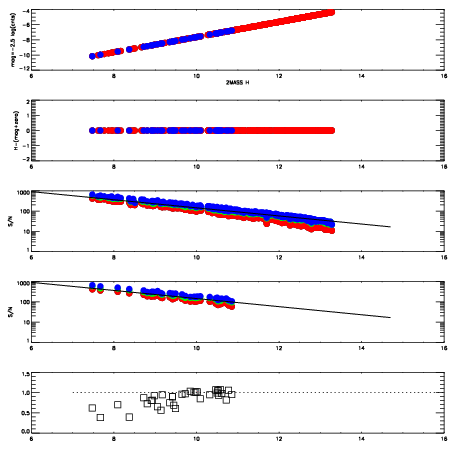


| Frame | Nreads | Zeropoints | Mag plots | Spatial mag deviation | Spatial sky 16325A emission deviations (filled: sky, open: star) | Spatial sky continuum emission | Spatial sky telluric CO2 absorption deviations (filled: H < 10) | |||||||||||||||||||||||
| 0 | 0 |
|
|
|
|
|
|
| IPAIR | NAME | SHIFT | NEWSHIFT | S/N | NAME | SHIFT | NEWSHIFT | S/N |
| 0 | 07520051 | 0.478175 | 0.00000 | 19.0143 | 07520049 | 0.00000 | 0.478175 | 19.0138 |
| 1 | 07520050 | 0.477895 | 0.000280023 | 19.0042 | 07520060 | 0.00585053 | 0.472324 | 19.0096 |
| 2 | 07520054 | 0.476764 | 0.00141102 | 18.9610 | 07520056 | 0.00125798 | 0.476917 | 19.0042 |
| 3 | 07520059 | 0.474283 | 0.00389200 | 18.9402 | 07520052 | 0.00237447 | 0.475801 | 18.9875 |
| 4 | 07520055 | 0.477298 | 0.000877023 | 18.9284 | 07520057 | 0.00375402 | 0.474421 | 18.9470 |
| 5 | 07520058 | 0.472672 | 0.00550303 | 18.9224 | 07520053 | 5.36896e-05 | 0.478121 | 18.9275 |