| Red | Green | Blue | |
| z | 17.64 | ||
| znorm | Inf | ||
| sky | -NaN | -Inf | -Inf |
| S/N | 21.6 | 39.7 | 43.8 |
| S/N(c) | 0.0 | 0.0 | 0.0 |
| SN(E/C) |

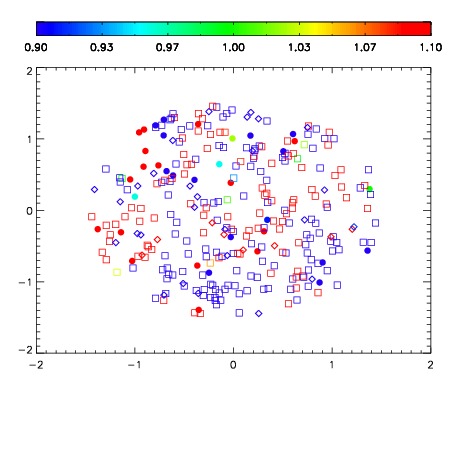


| Frame | Nreads | Zeropoints | Mag plots | Spatial mag deviation | Spatial sky 16325A emission deviations (filled: sky, open: star) | Spatial sky continuum emission | Spatial sky telluric CO2 absorption deviations (filled: H < 10) | |||||||||||||||||||||||
| 0 | 0 |
|
|
|
|
|
|
| IPAIR | NAME | SHIFT | NEWSHIFT | S/N | NAME | SHIFT | NEWSHIFT | S/N |
| 0 | 07280076 | 0.484316 | 0.00000 | 18.6801 | 07280074 | 0.000246483 | 0.484069 | 18.7476 |
| 1 | 07280072 | 0.483544 | 0.000771999 | 18.8866 | 07280070 | 0.00000 | 0.484316 | 18.9370 |
| 2 | 07280071 | 0.482574 | 0.00174201 | 18.7649 | 07280073 | 0.00219258 | 0.482123 | 18.7760 |
| 3 | 07280075 | 0.483922 | 0.000393987 | 18.6284 | 07280077 | 0.00177146 | 0.482545 | 18.4922 |